employment
inequality
inactivity
Participation gaps and hidden inequalities in the West of England
Against a backdrop of strong labour market performance, challenges related to participation and economic inclusion are hampering the West of England’s long-term economic resilience, with structural inequalities reducing equal access to opportunity.
This policy insight utilises data from the Annual Population Survey (APS) to understand the distribution of employment across a variety of socio-demographic indicators. The insight also uses data from the National Client Caseload Information System and the Department for Education’s IN21 destinations dataset to look at rates for those not in education, employment or training (NEET) and the employment destinations of young people within the West of England.
The West of England’s employment rate is higher than the national average, but significant inclusion gaps remain. Geographic disparities, persistent inequalities related to disability and gender, and uneven post-16 transitions limit the number of people able or willing to work (labour supply) and hinder inclusive growth.
Targeted action to strengthen post-16 pathways and widen access to work, especially for disabled people and those from disadvantaged backgrounds, will be key to boosting participation and supporting long-term economic resilience.
Employment gaps by gender, age, ethnicity and disability
The West of England's employment rate is strong overall, but some groups face exclusion from the labour market, with gaps persisting across key demographic indicators.
The employment rate for men aged 16-64 (81.2%) in the region exceeds that for women (77.3%), although both are higher than the England averages (79.0% and 72.3% respectively) (see Figure 1). These figures also represent a smaller gender employment gap than the England average (Office for National Statistics Annual Population Survey, ONS APS, 2025).
The gender employment gap varies across the region. Bath and North East Somerset has the largest gap (4.8 percentage points), while North Somerset reports slightly higher employment among women than men, potentially reflecting sector mix and a greater prevalence of flexible or part-time roles in health, education and retail.
Figure 1: Employment rate in the West of England by gender and region, 2025
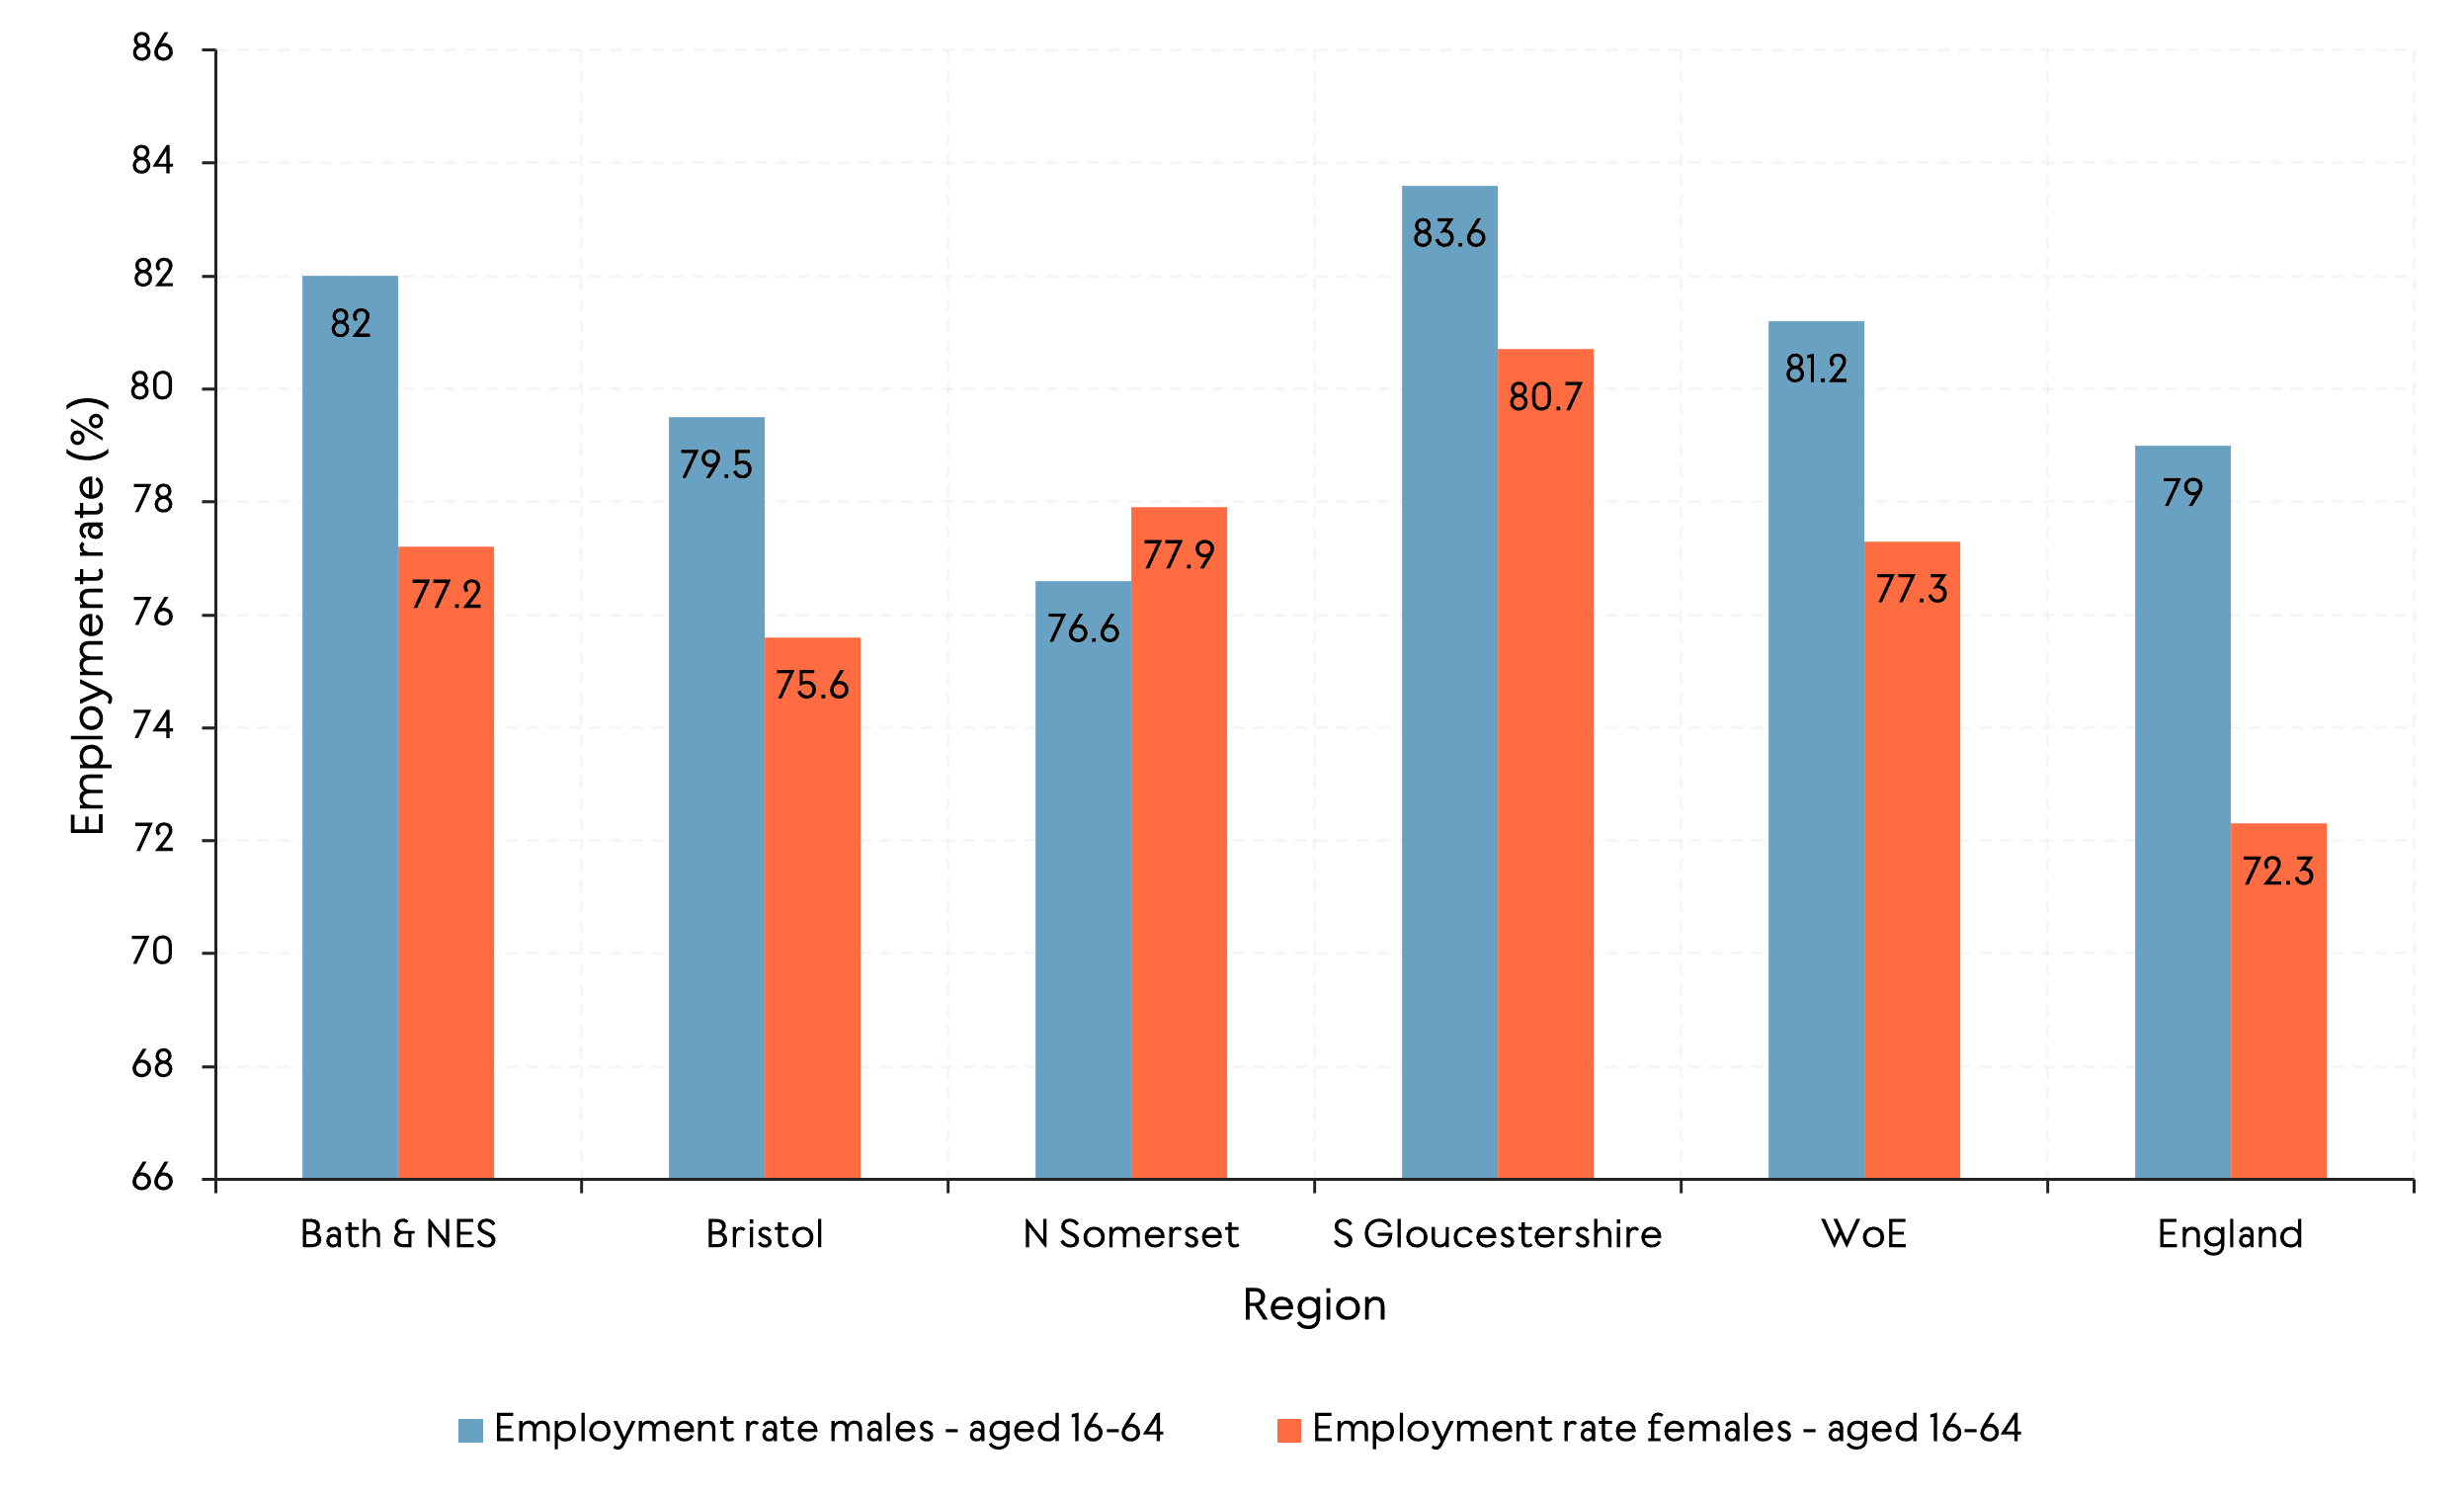
Source: ONS Annual Population Survey (03/2025)
Looking at the employment rate by age shows the region's strong mid-career performance. The employment rate in the West of England is above the England average across all age bands, but highest among those aged 35-49 (89%), followed by 25-34 (85%). For younger adults (those aged 20-24), the employment rate is somewhat lower, at 73% (see Figure 2).
South Gloucestershire ranks either highest or second highest across most age bands, reinforcing its strong labour market. North Somerset is unique in having a higher employment rate among those aged 25-34 than 35-49, suggesting a slightly different age-profile among workers or local job structure.
Figure 2: Employment rate in the West of England by age and region, 2025
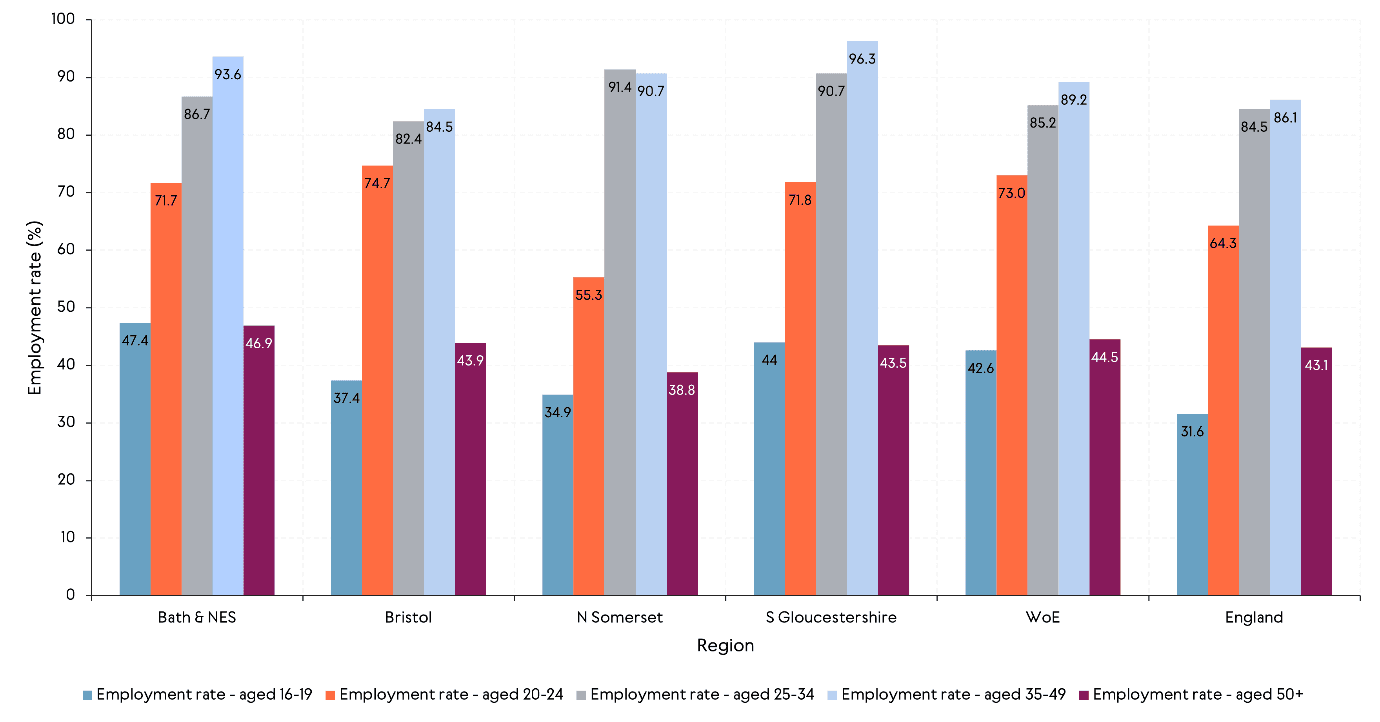
Source: ONS Annual Population Survey (03/2025)
Gaps in the employment rate between people of different ethnicities in the West of England are smaller than those in many other areas of the country. But these figures do vary by local authority (see Figure 3).
Across the region, employment among white residents is 79.9% compared with 74.1% for ethnic minority residents. The ethnicity employment gap is largest in North Somerset (18 percentage points) and smallest in Bristol (4.8 percentage points). While North Somerset’s smaller ethnic minority population implies a smaller sample in the ONS APS – and greater volatility – the size of the gap still signals potential access and inclusion challenges that are distinct from more diverse labour markets, such as those in Bristol or Bath.
Figure 3: Employment rate in the West of England by ethnicity and region, 2025
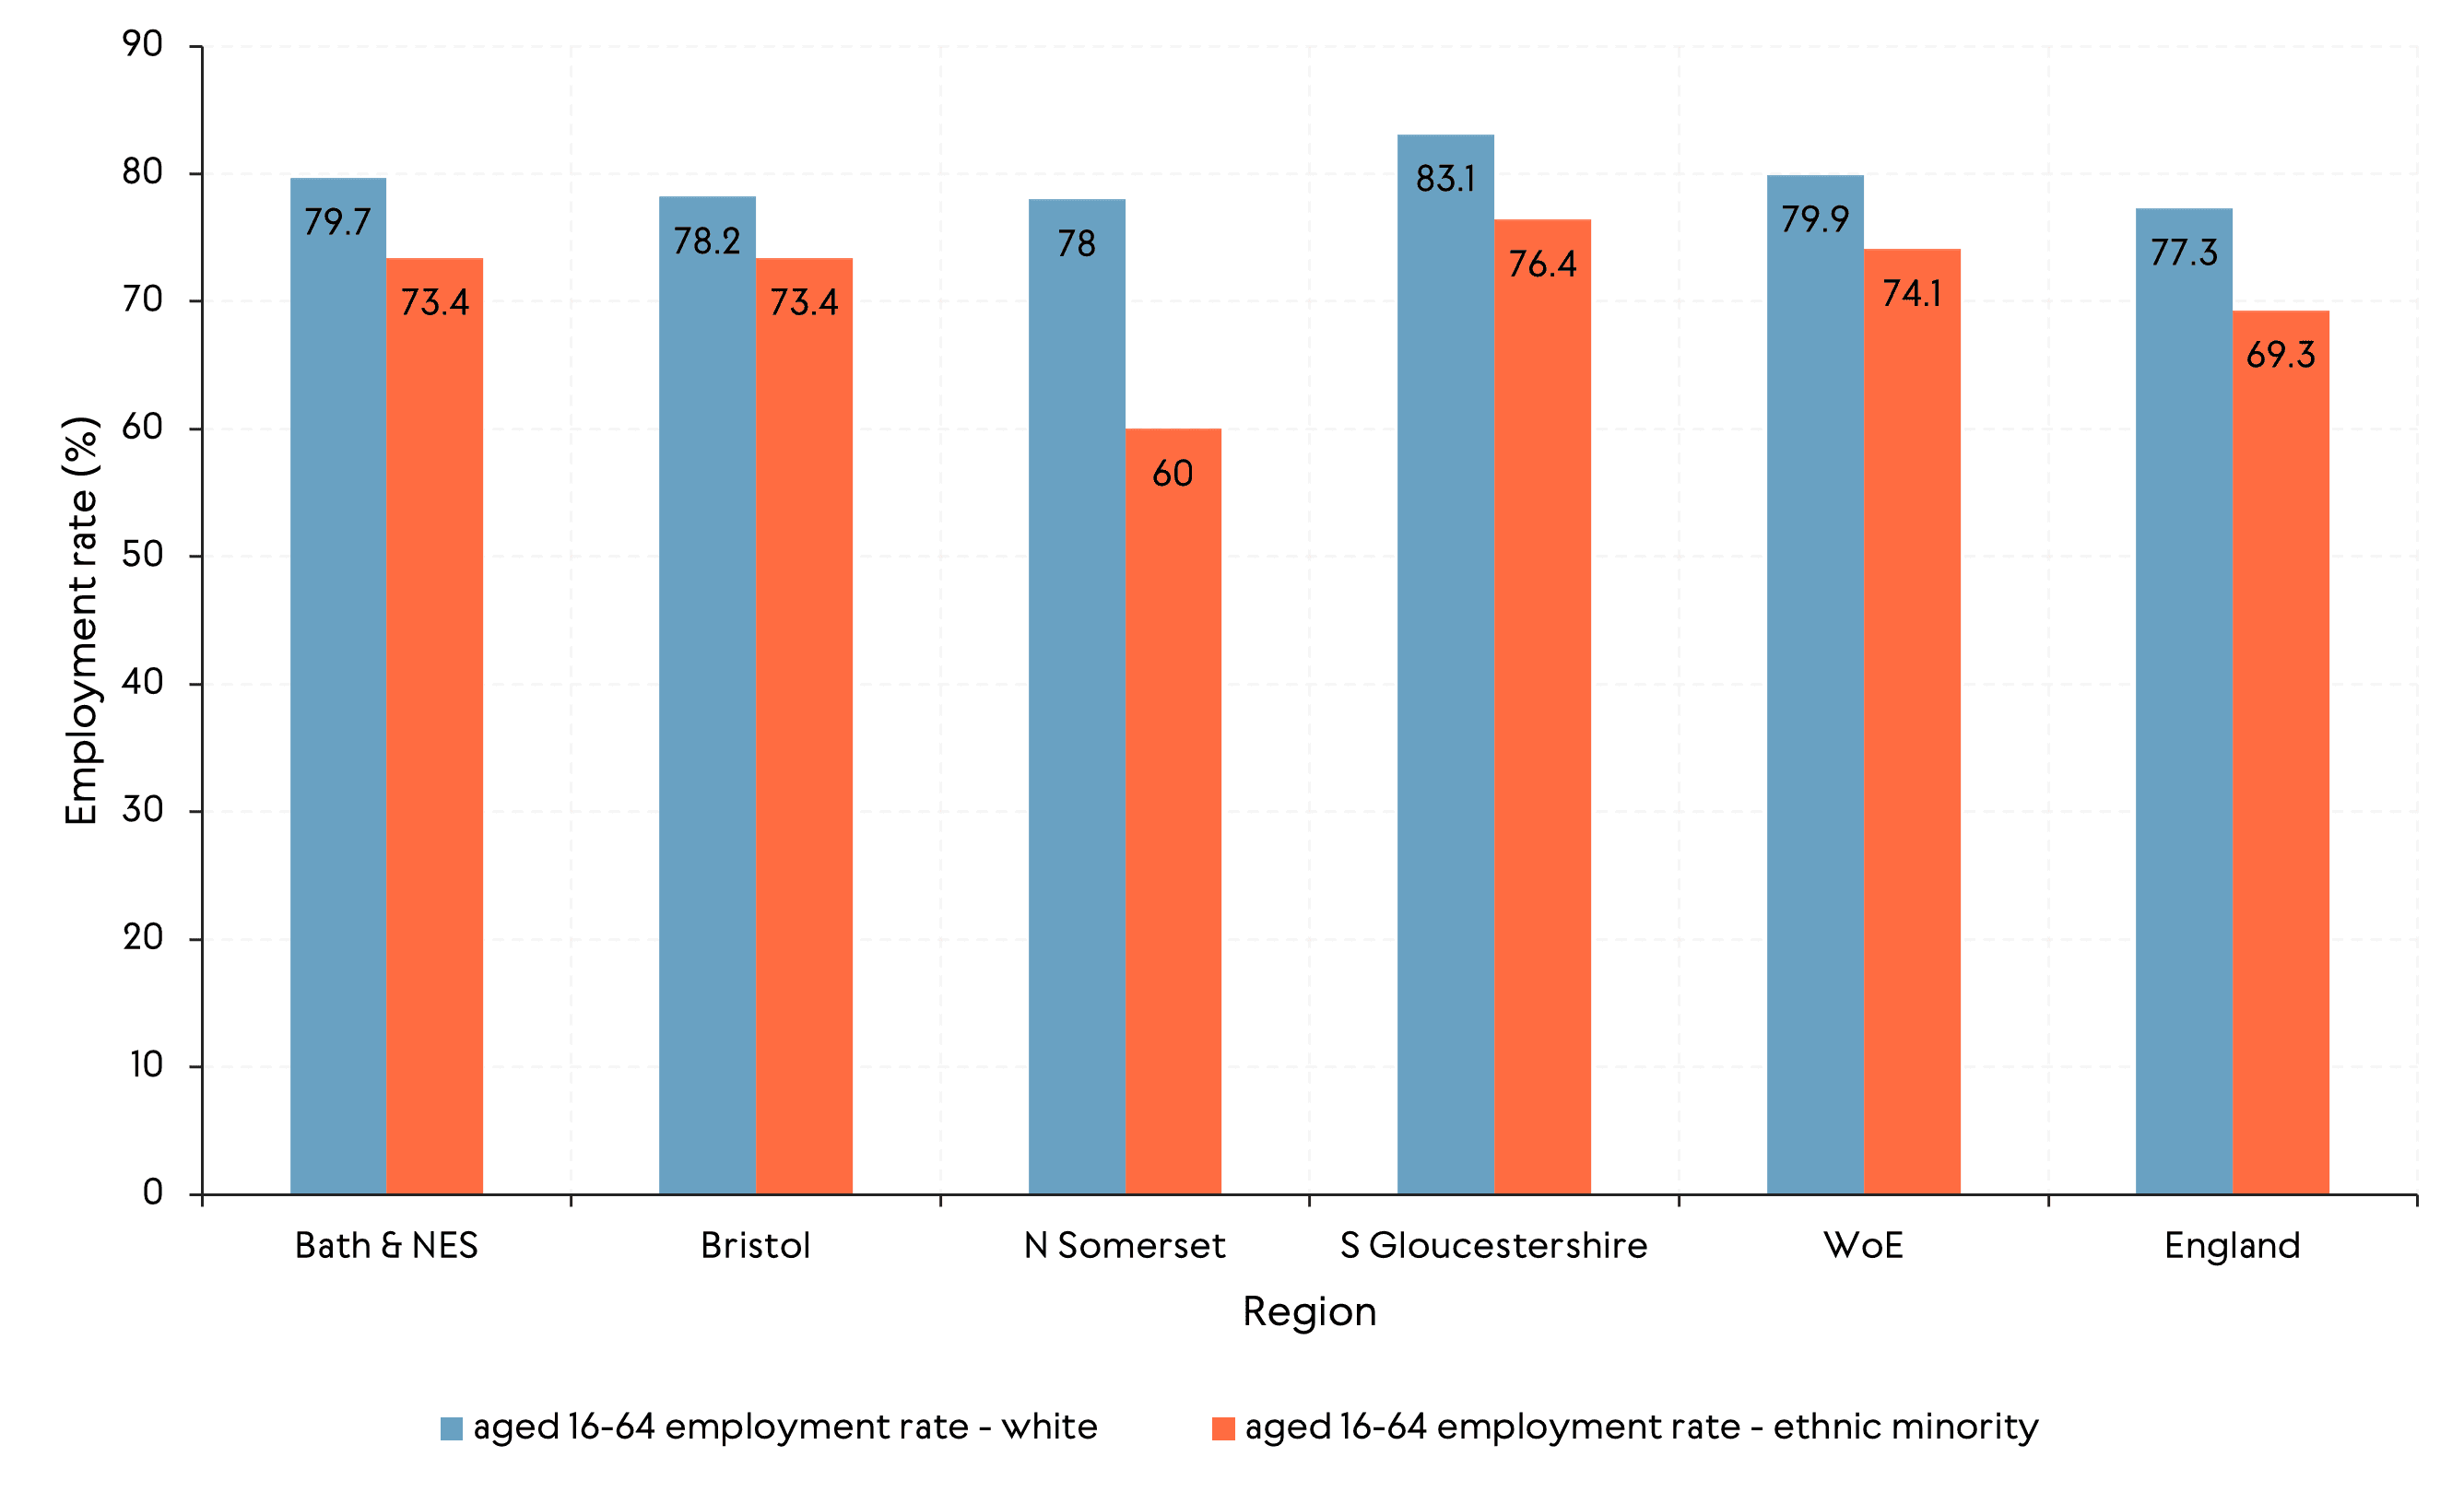
Source: ONS Annual Population Survey (03/2025)
Disability-related inequality is a persistent challenge in the region. The disability employment gap in the West of England has remained above 12 percentage points throughout the period 2018-25, peaking at 18 percentage points in 2020–21 and rising again to around 16 percentage points by 2025 (see Figure 4).
While small sample sizes in the data warrant caution for single-year interpretation, the renewed widening suggests that accessibility barriers and health-related constraints are limiting workforce participation for many disabled individuals.
Figure 4: Disability employment gap in the West of England, 2018-25
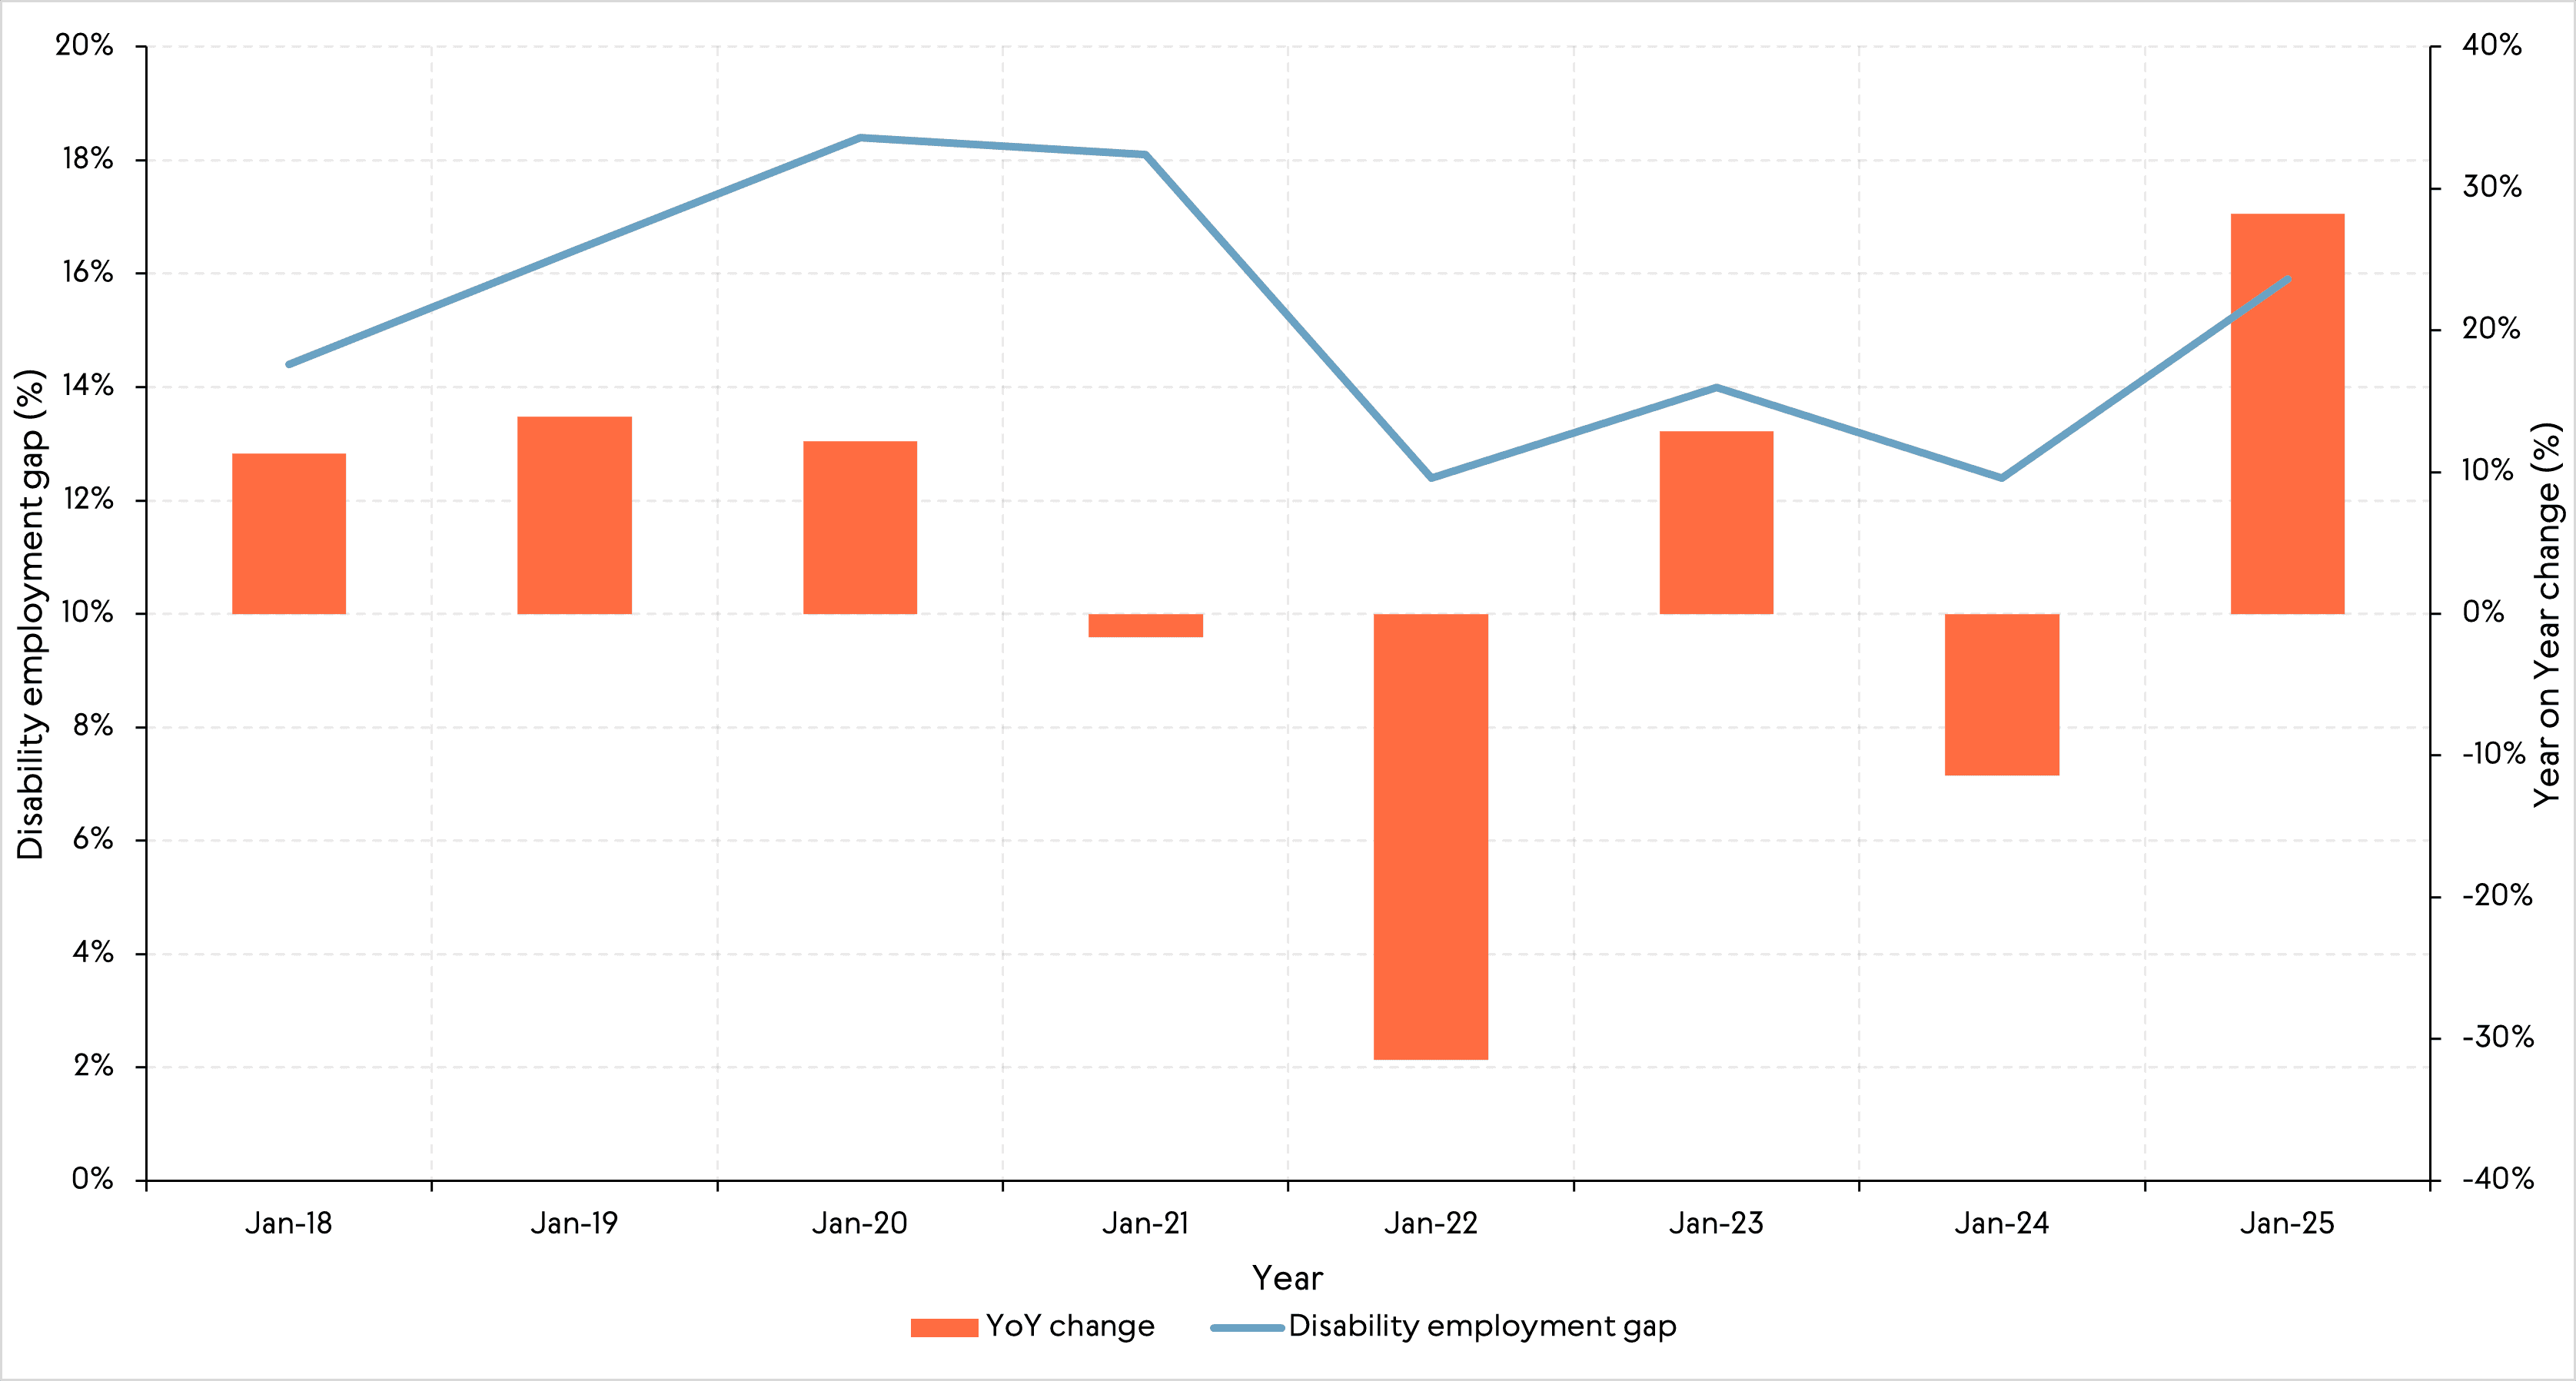
Source: ONS Annual Population Survey (03/2018-03/2025)
Youth transitions into employment
Headline employment rates can understate any exclusion of young people from the workforce, particularly during transitions from education to work. At the Combined Authority (International Territorial Level 2, ITL2) level, the Gloucestershire, Wiltshire and Bath/Bristol area records an average youth unemployment rate of 12.52% in the period 2014-24, ranking 25th out of the 41 ITL2 regions nationally and 1.57 percentage points below the UK average (14.09%) (Labour Force Survey/Social Mobility DR32, 2014-24). This suggests that the region is comparatively better than the national norm at getting young people into work, sitting broadly in line with neighbouring South West areas (for example, Dorset and Somerset at 12.39% and Cornwall and Isles of Scilly at 11.90%).
But this regional youth unemployment rate does not reveal who is most likely to be excluded from the workforce. Two additional indicators show that socio-economic background and sub-regional location are sources of disadvantage across the West of England. First, not in education, employment or training (NEET) rates for 16 and 17 year olds vary across the region. Bristol faces the most acute NEET challenges and a clear gender gap: around 6.5% of young men are NEET compared with 5.5% of young women (see Figure 5). Other local authorities show smaller gaps or slight gender reversals.
Figure 5: Proportion of 16 and 17 year olds NEET in the West of England by gender, 2025
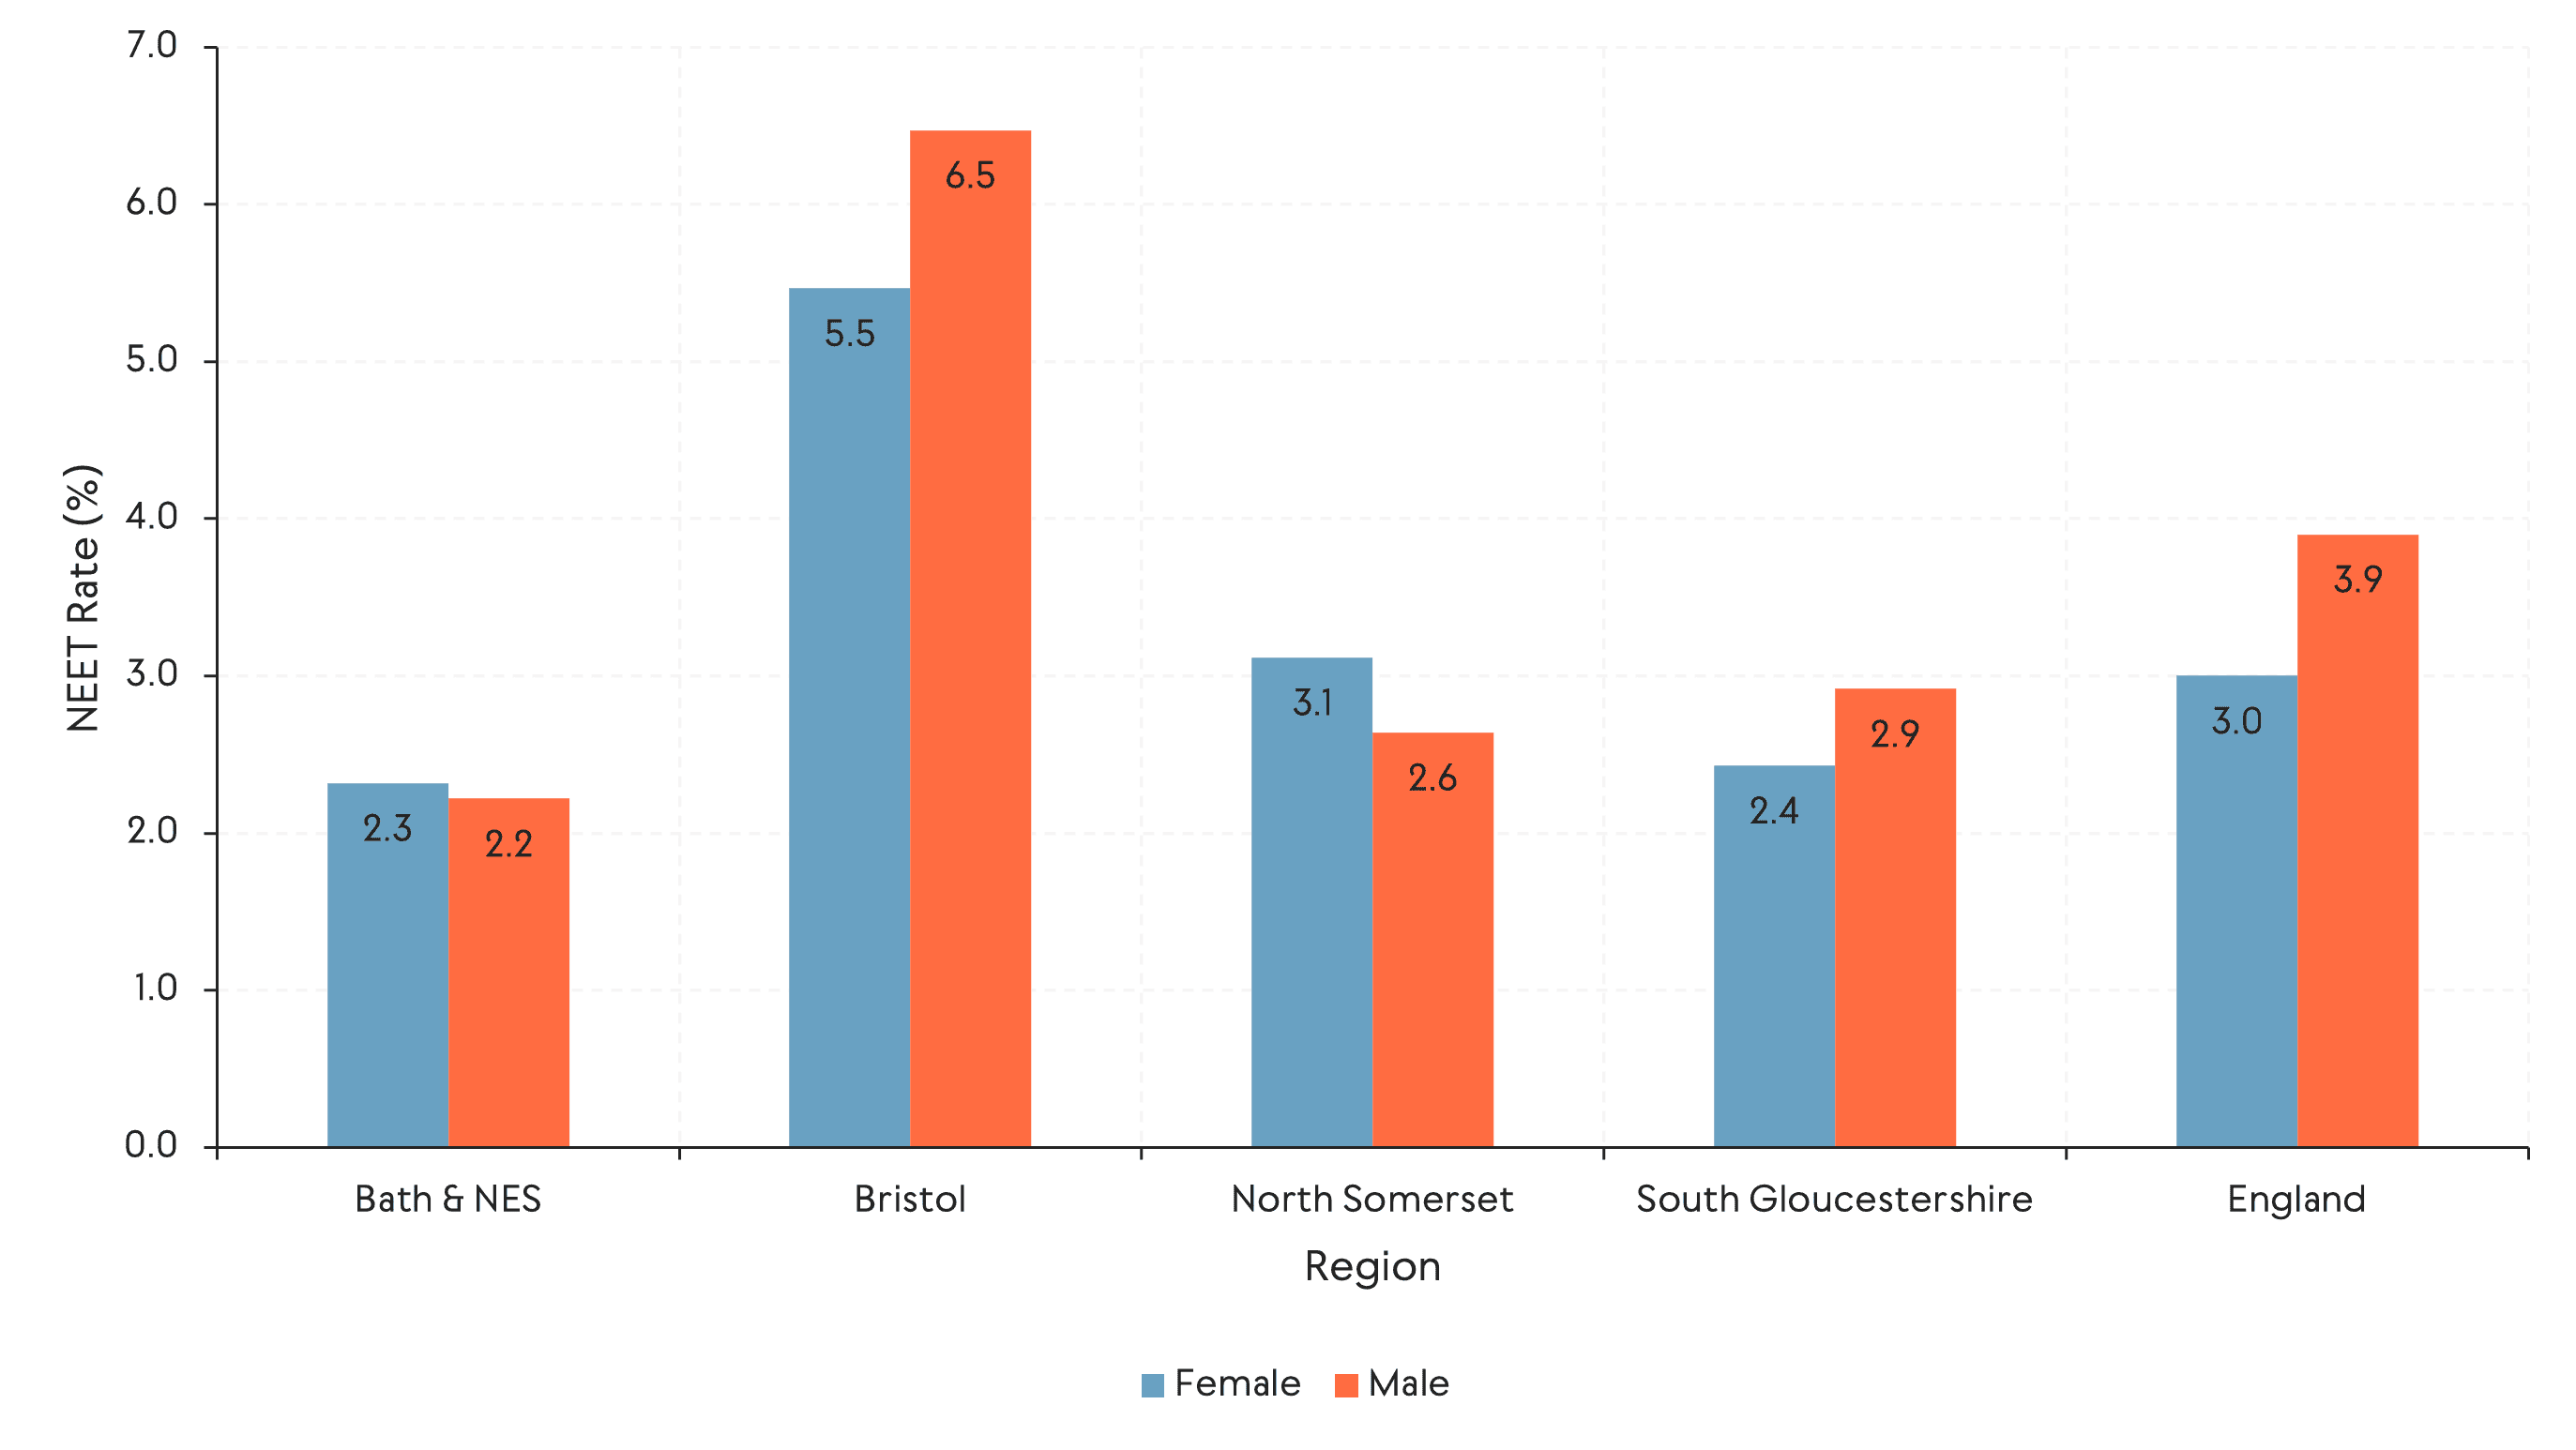
Source: National Client Caseload Information System, 2025
NEET rates for 16 and 17 year olds vary significantly between local authority areas (see Figure 6). Bristol shows the most notable shift, with its NEET rate rising from around 2.8% in 2019 to almost 6% in 2025. The steepest increases occur after 2023, placing Bristol above the England average and signalling growing challenges in sustaining post‑16 participation. By contrast, the region's other three authorities present more stable trajectories.
Figure 6: Proportions of 16 and 17 year olds NEET in the West of England, 2019-25
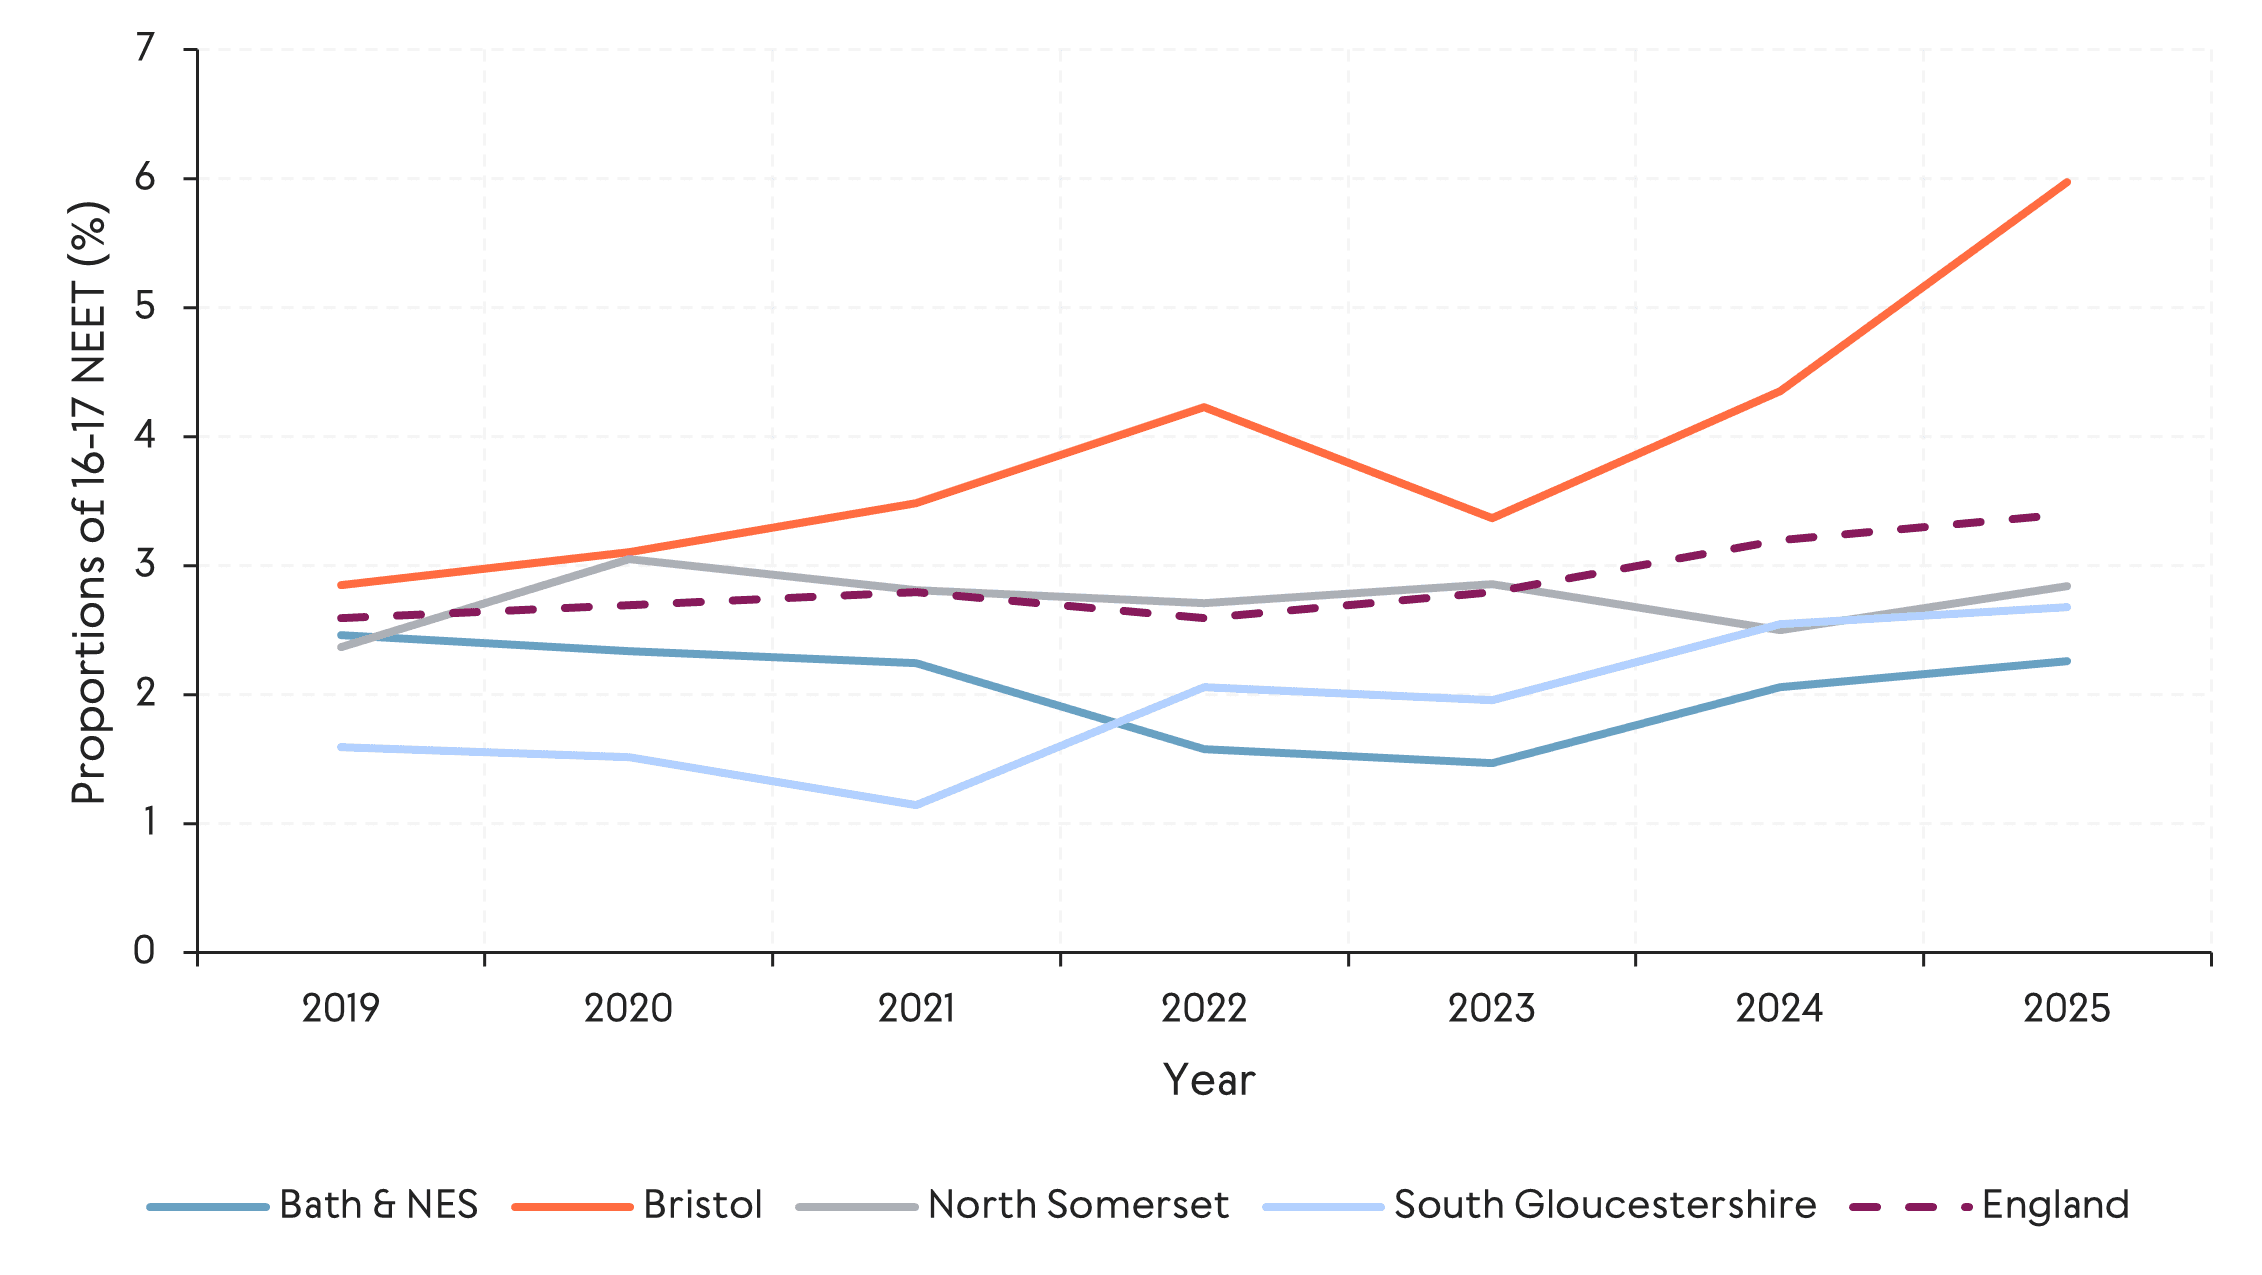
Source: National Client Caseload Information System, 2025
Data also shows that young people's destinations after compulsory education vary significantly by socio-economic background. Within the West of England, young people from higher-professional households in 2024 were 8.4 percentage points more likely to be in employment and 13.2 percentage points less likely to be NEET than those from lower-working-class households (Department for Education, 2024). This implies that even in relatively strong labour markets, economic exclusion is concentrated among young people from less advantaged backgrounds.
Conclusion
The West of England has a relatively high employment rate, compared with the England average. But notable inclusion gaps exist. Spatial disparities, sustained disability and gender inequalities alongside unequal youth transitions, reduce the region’s effective labour supply and constrain inclusive growth.
Youth NEET levels are particularly striking: even though the region's unemployment rate is below the UK average, youth NEET concentrations indicate that economic participation is not evenly distributed. This early exclusion from the workforce risks lower lifetime earnings and reduced productivity.
Targeted interventions that strengthen post-16 pathways and improve access to work for all young people, including disability inclusion and support for those from disadvantaged backgrounds, are key to improving both participation and long-run economic resilience.
References
Department for Education (2024) National Client Caseload Information System (NCCIS): NEET statistics. London: DfE.
Department for Education (2024) Destinations of KS4 and KS5 pupils (Indicator IN21). London: DfE.
Office for National Statistics (2025) Annual Population Survey, March 2015–March 2025. Newport: ONS. Available at: https://www.ons.gov.uk
Office for National Statistics (2024, 2025) Labour Force Survey (LFS): Social Mobility Dataset DR32. Newport: ONS.


