productivity
inactivity
skills
High performance and hidden pressures in the West of England labour market
The West of England continues to outperform national labour market averages, but widening gaps between local authority areas show that while the region performs strongly overall, it is increasingly uneven. This underlines the need for tailored and inclusive policy responses.
This policy insight examines the performance of the labour market in the West of England, drawing on official data from the Office for National Statistics (ONS). It identifies trends in several headline indicators and highlights variation across the four constituent local authorities: Bath and North East Somerset, Bristol, North Somerset and South Gloucestershire.
Headline indicators show that the West of England has a strong yet uneven labour market. The region, particularly South Gloucestershire, consistently performs above the England average on key measures like employment, which has increased over the past decade and rebounded well from the pandemic.
Despite strengths, disparities persist between the local authorities, highlighting the need for place-specific and inclusive policy responses. For example, while overall unemployment is low, it is typically higher in Bristol than in neighbouring areas and inactivity rates point to structural differences in labour market participation. Outcomes for young people are diverging, with rates of those not in education, employment or training (NEET) for 16–17-year-olds rising sharply in Bristol but remaining broadly stable elsewhere.
Employment rate
Between 2015 and 2025, the employment rate in the West of England trended upwards, increasing from just under 76% to over 79%. The COVID-19 pandemic caused a temporary decline, but the employment rate has since recovered to pre-pandemic levels (see Figure 1). This recovery has been supported by a diverse economy and strong high-value sectors in the region.
Figure 1: The employment rate in the West of England, 2015-25
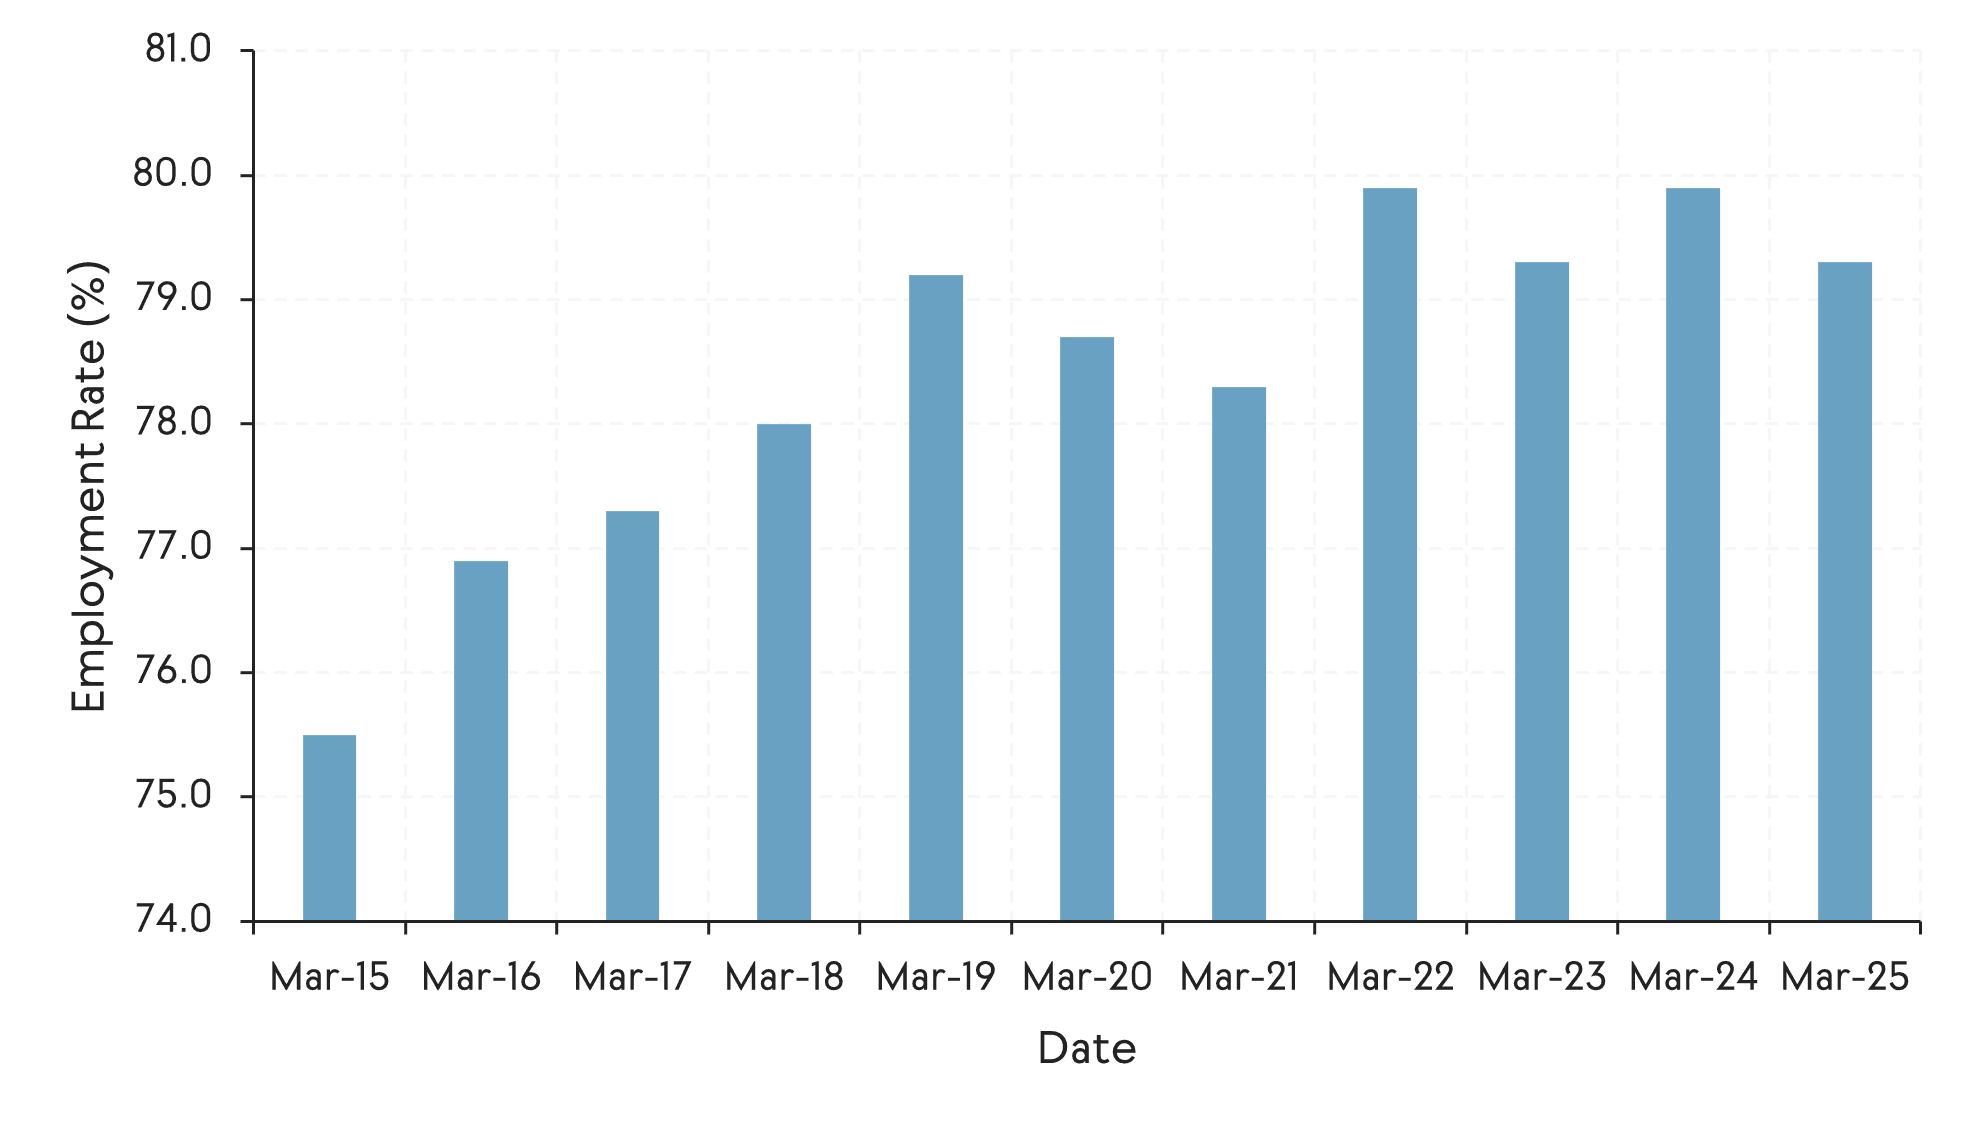
Source: ONS Annual Population Survey (03/2015-03/2025)
The employment rate in the West of England and all four of its local authorities also exceeded England’s national average of 76% in 2025, highlighting the region's relatively strong labour market performance (see Figure 2). Recent data show South Gloucestershire has the highest employment rate at 82%, followed by Bath and North East Somerset at 79%, Bristol at 78% and North Somerset at 77%.
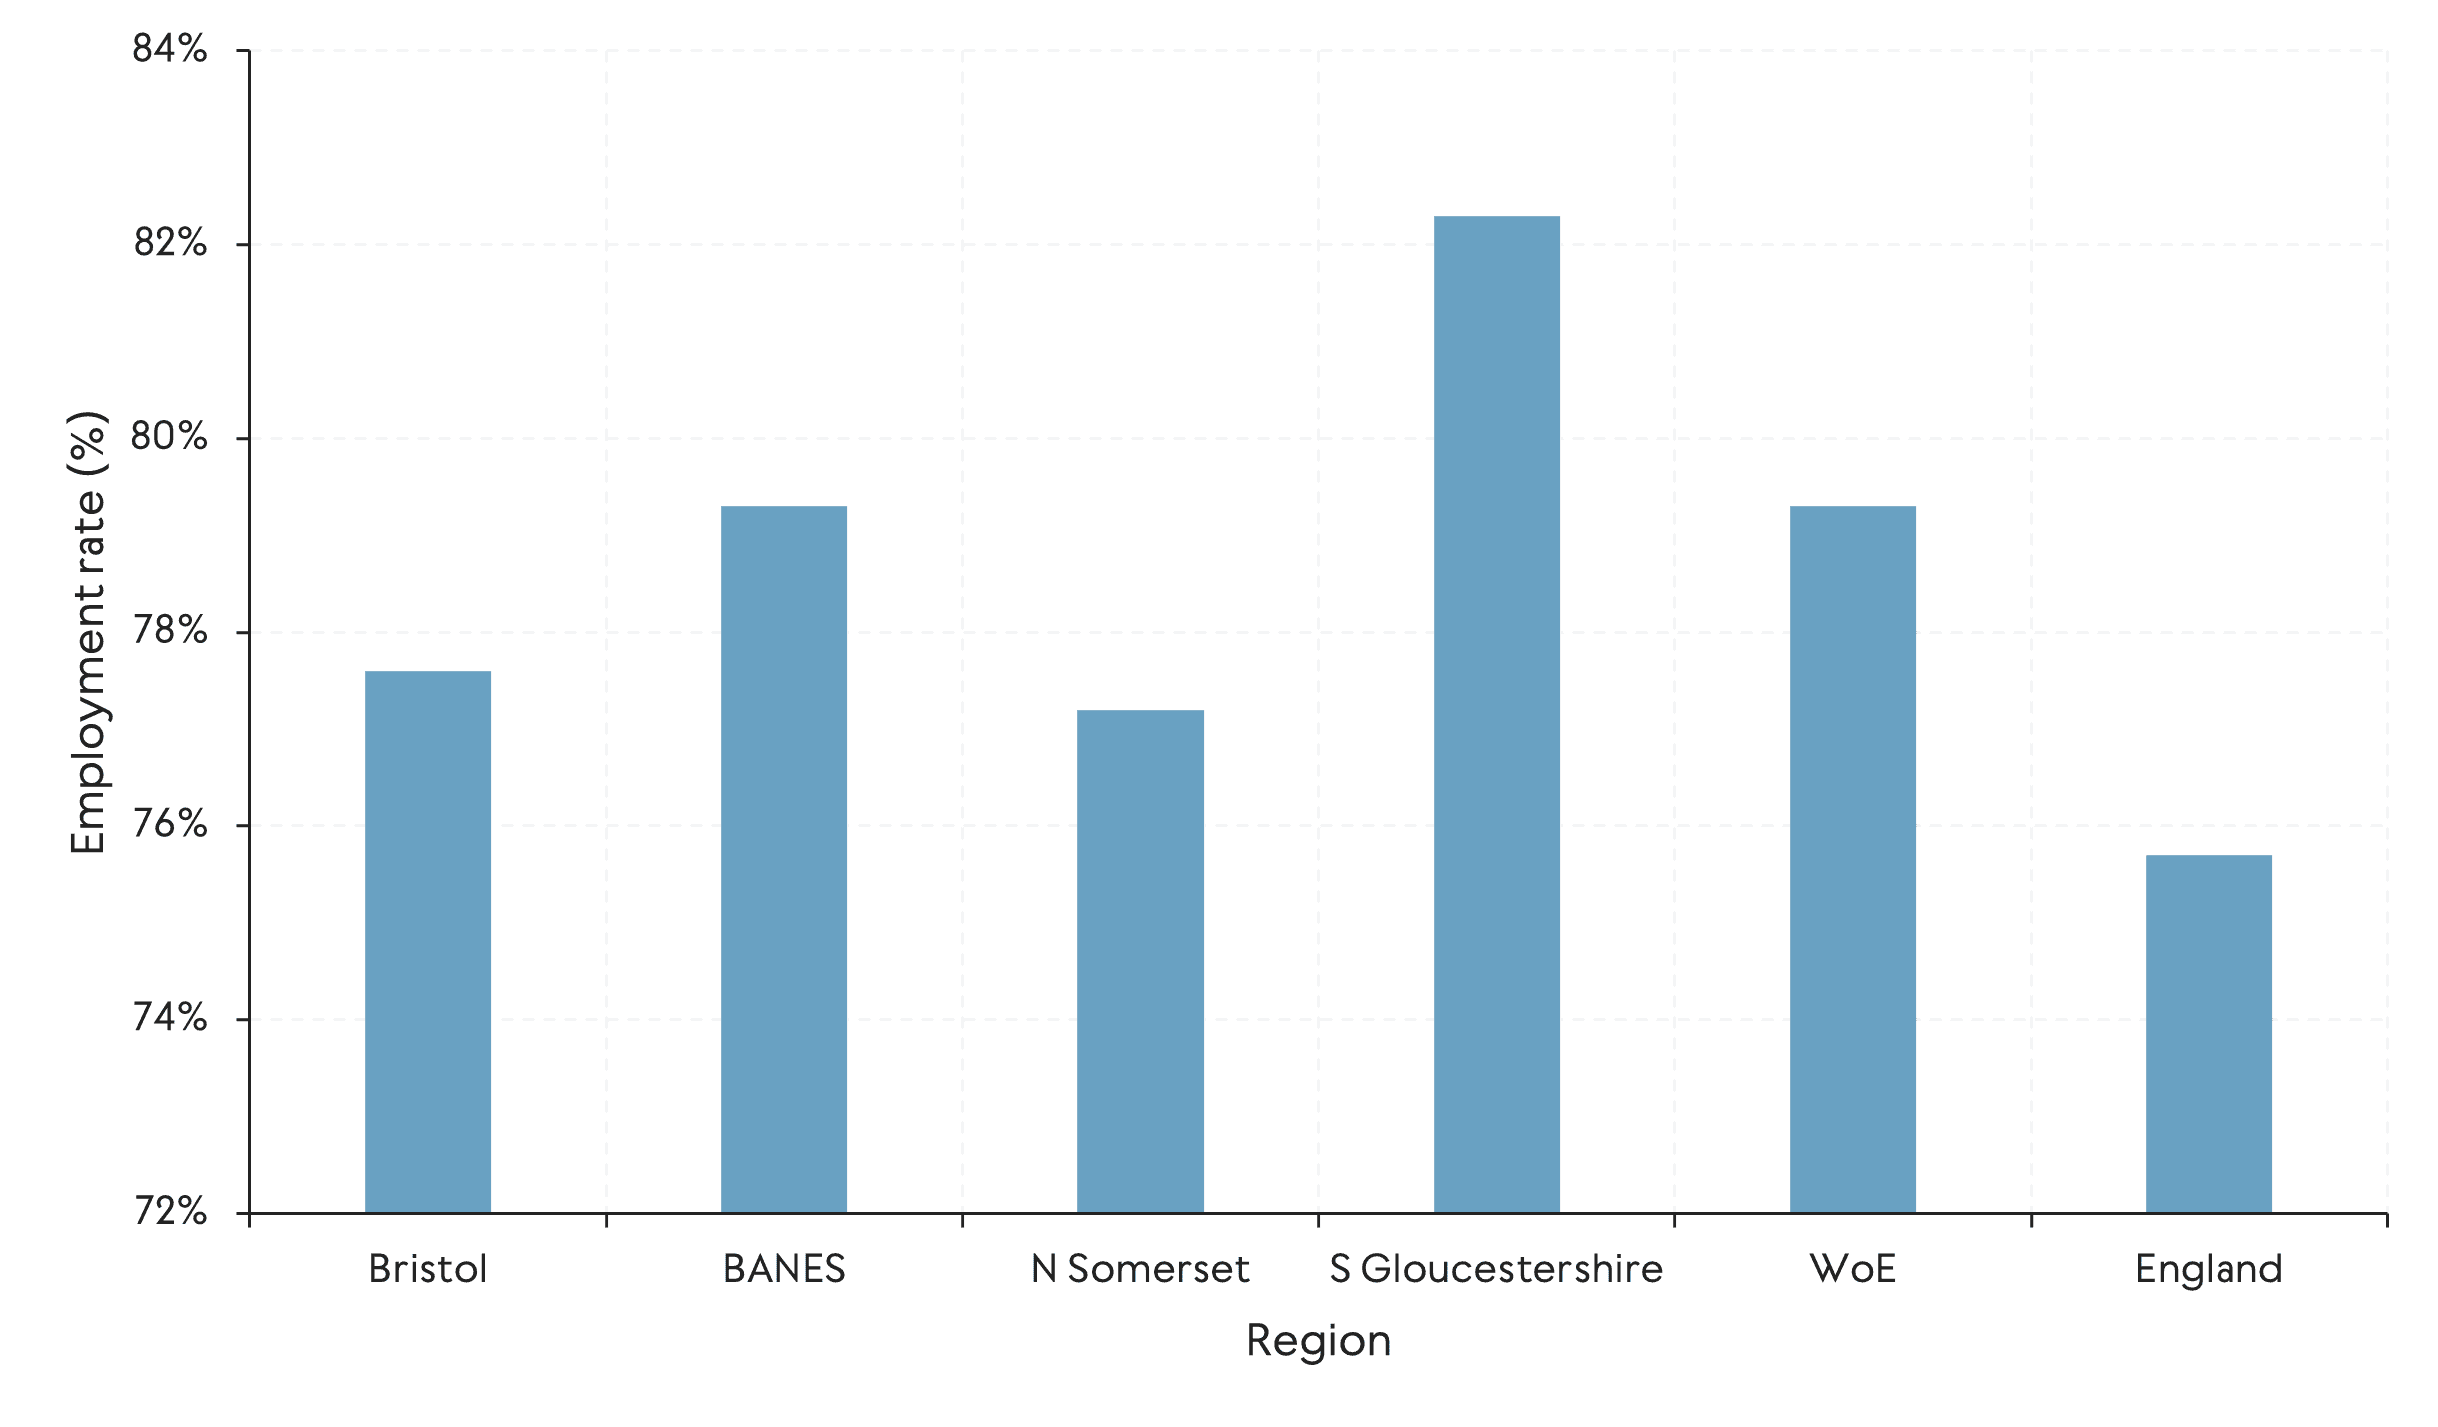
Source: ONS Annual Population Survey (03/2025)
Employment rate indexes comparing the performance over time between England, show the West of England and its local authorities have exceeded the England average (i.e. index of 100) every year since 2016 (see Figure 3). At the sub-regional level, Bath and North East Somerset has experienced more volatility, Bristol tends to track close to the national picture and South Gloucestershire and North Somerset have generally sustained higher long-term rates, although the latter fell relative to the England average after 2023.
Figure 3: Employment rate index in the West of England (England=100), 2016-25
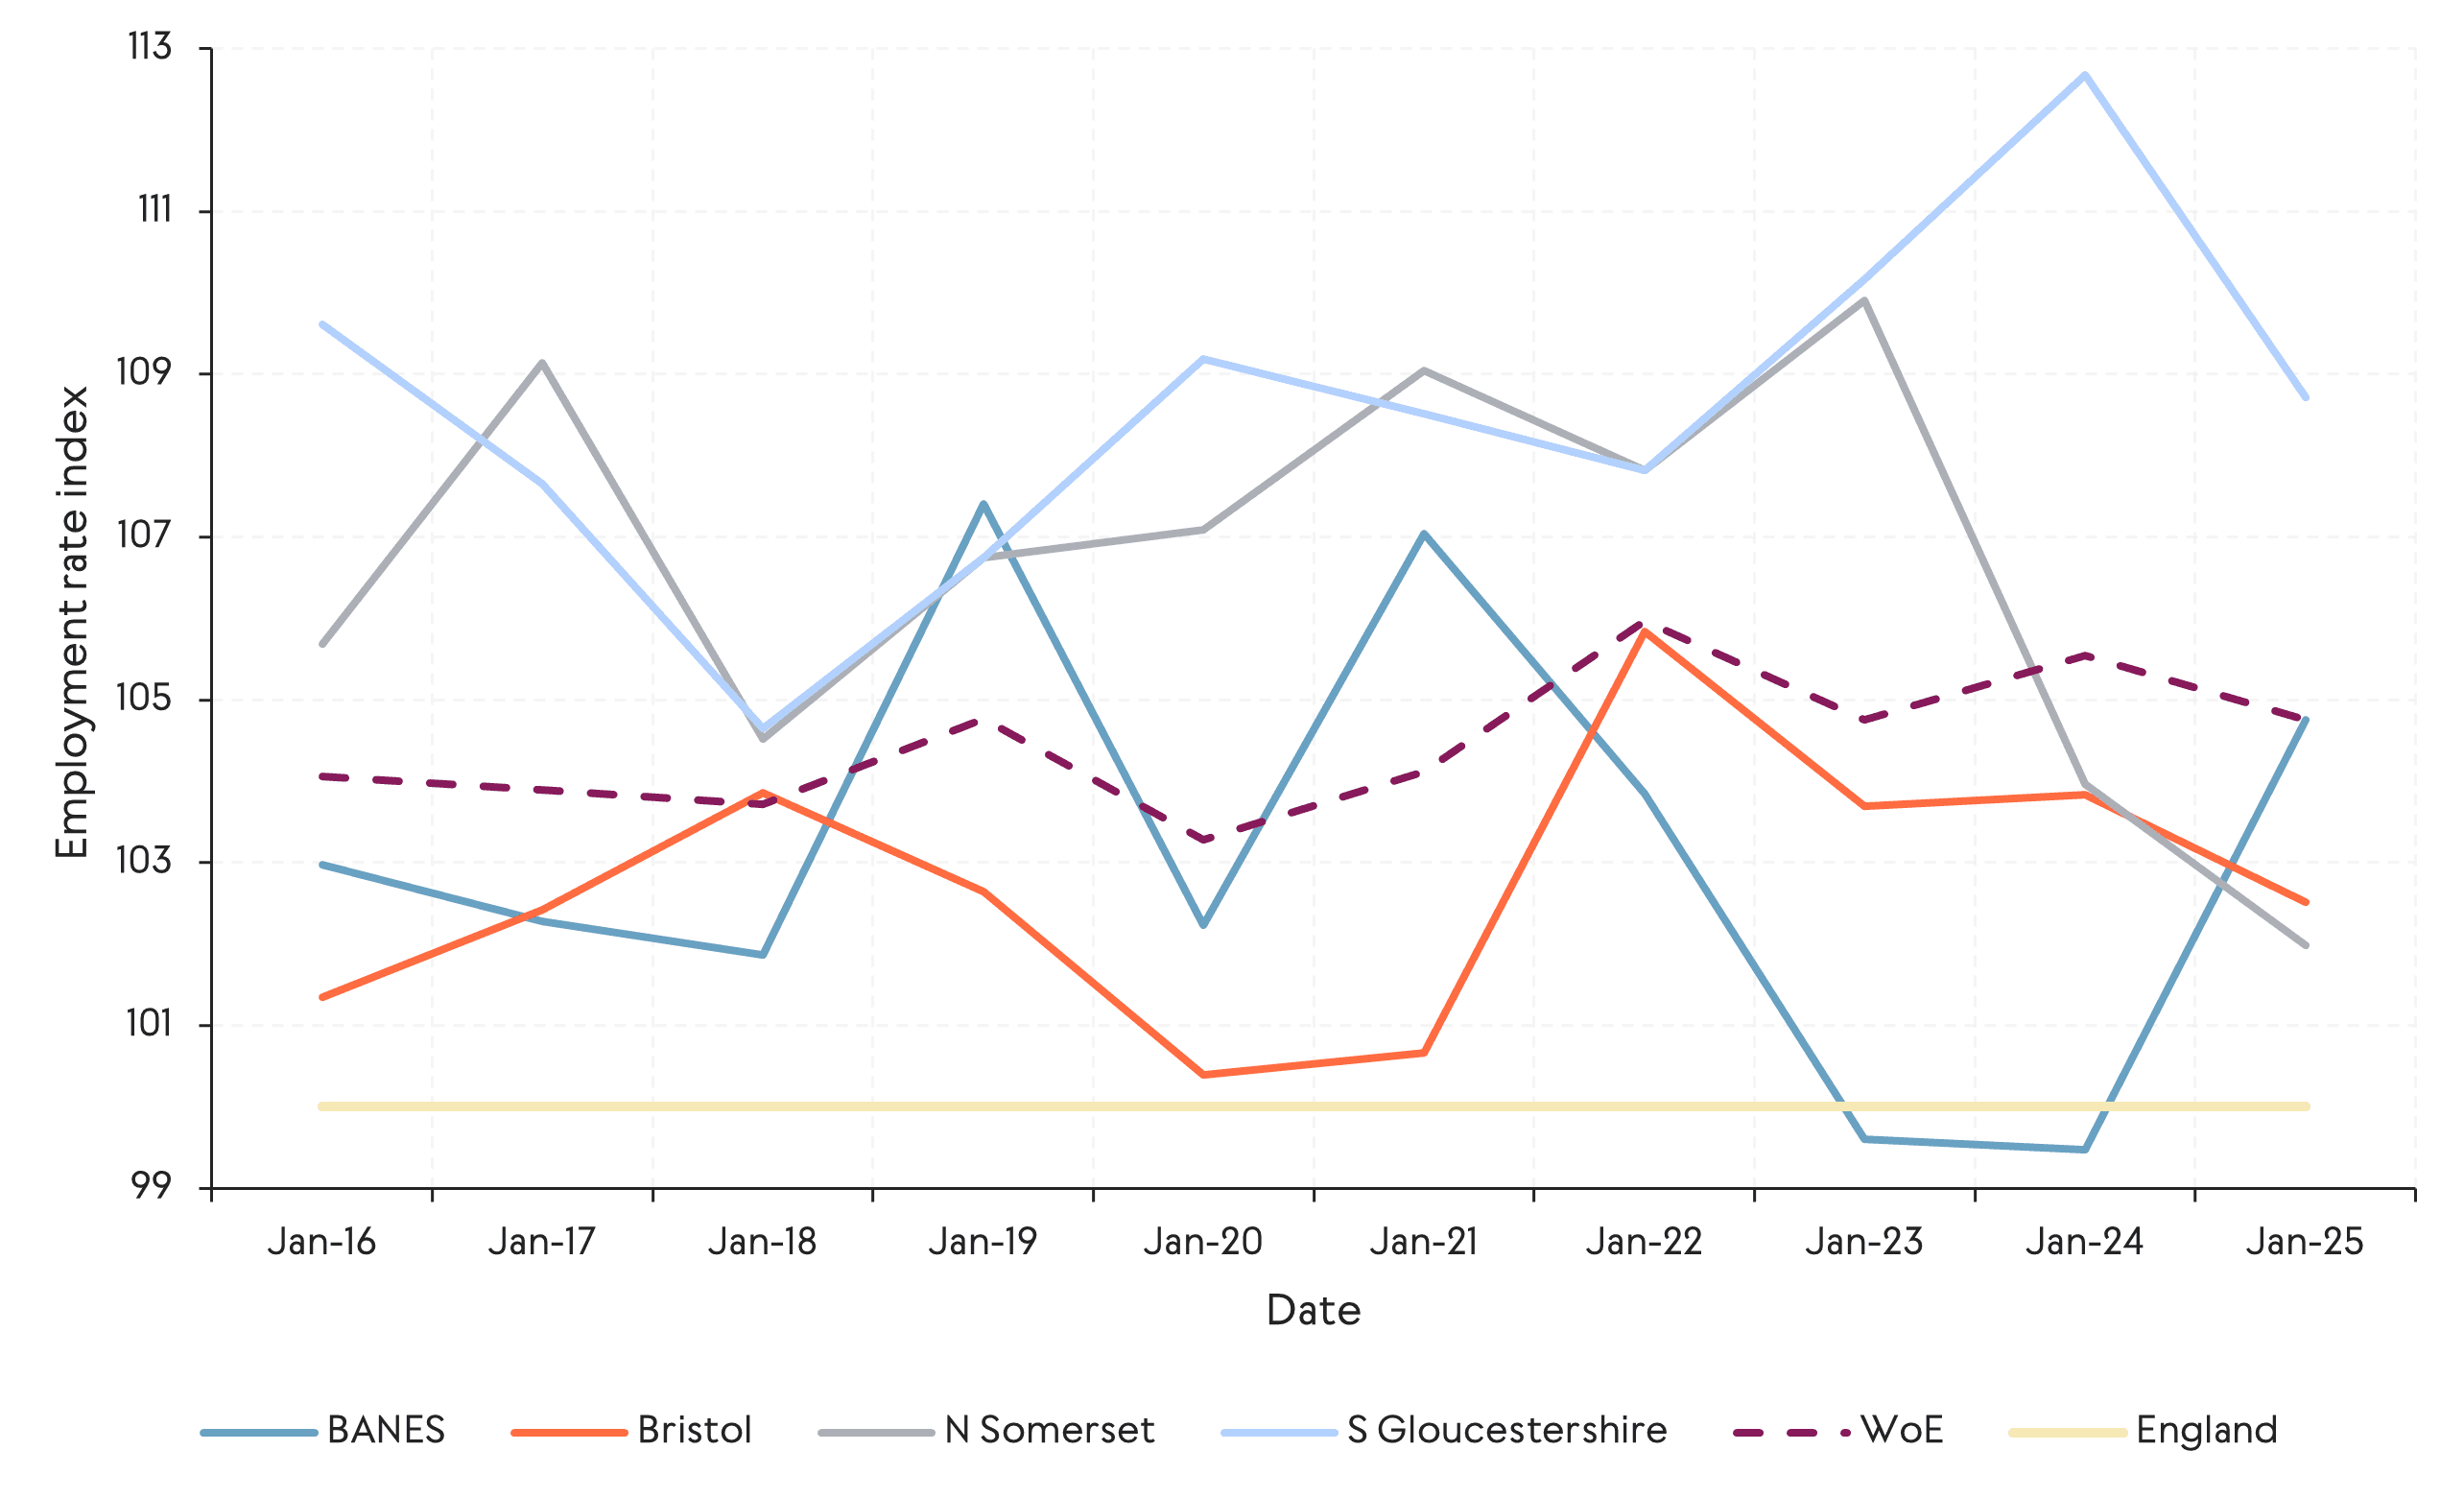
Source: ONS Annual Population Survey (03/2016-03/2025)
Unemployment rate
While employment rates indicate the extent to which people are in work, they do not capture the availability of labour. Examining unemployment figures alongside the employment rate provides a more complete assessment of labour market conditions, improving understanding of the number of people actively seeking work.
Unemployment in the West of England declined from around 5% in 2015 to approximately 4% in 2025, remaining consistently lower than the England average. The unemployment rate dropped to just over 2% in 2022, before rising slightly (see Figure 4).
Figure 4: Unemployment rates in the West of England and England, 2015-25
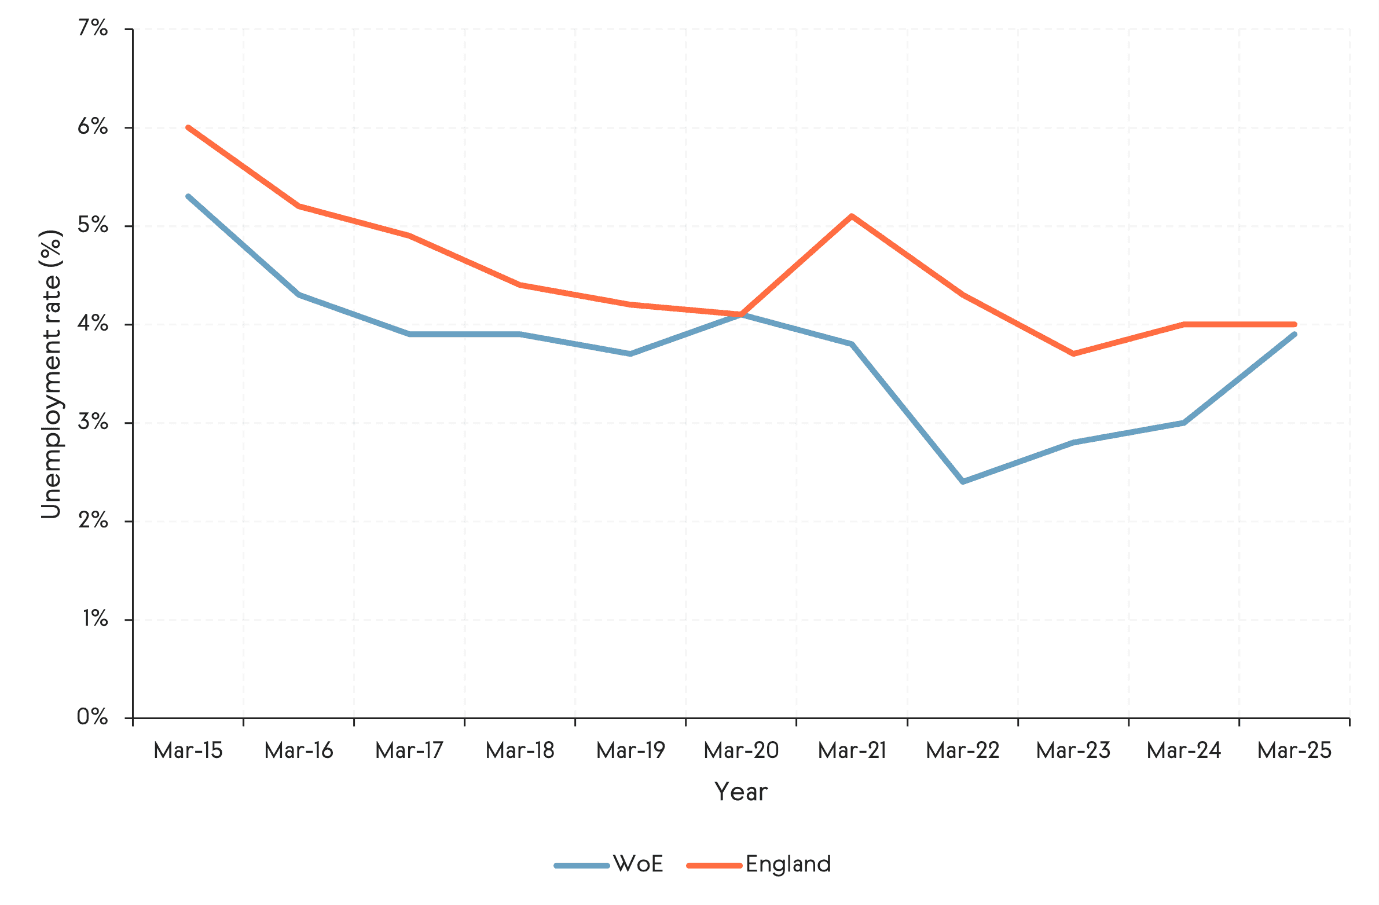
Source: ONS Annual Population Survey (03/2015-03/2025)
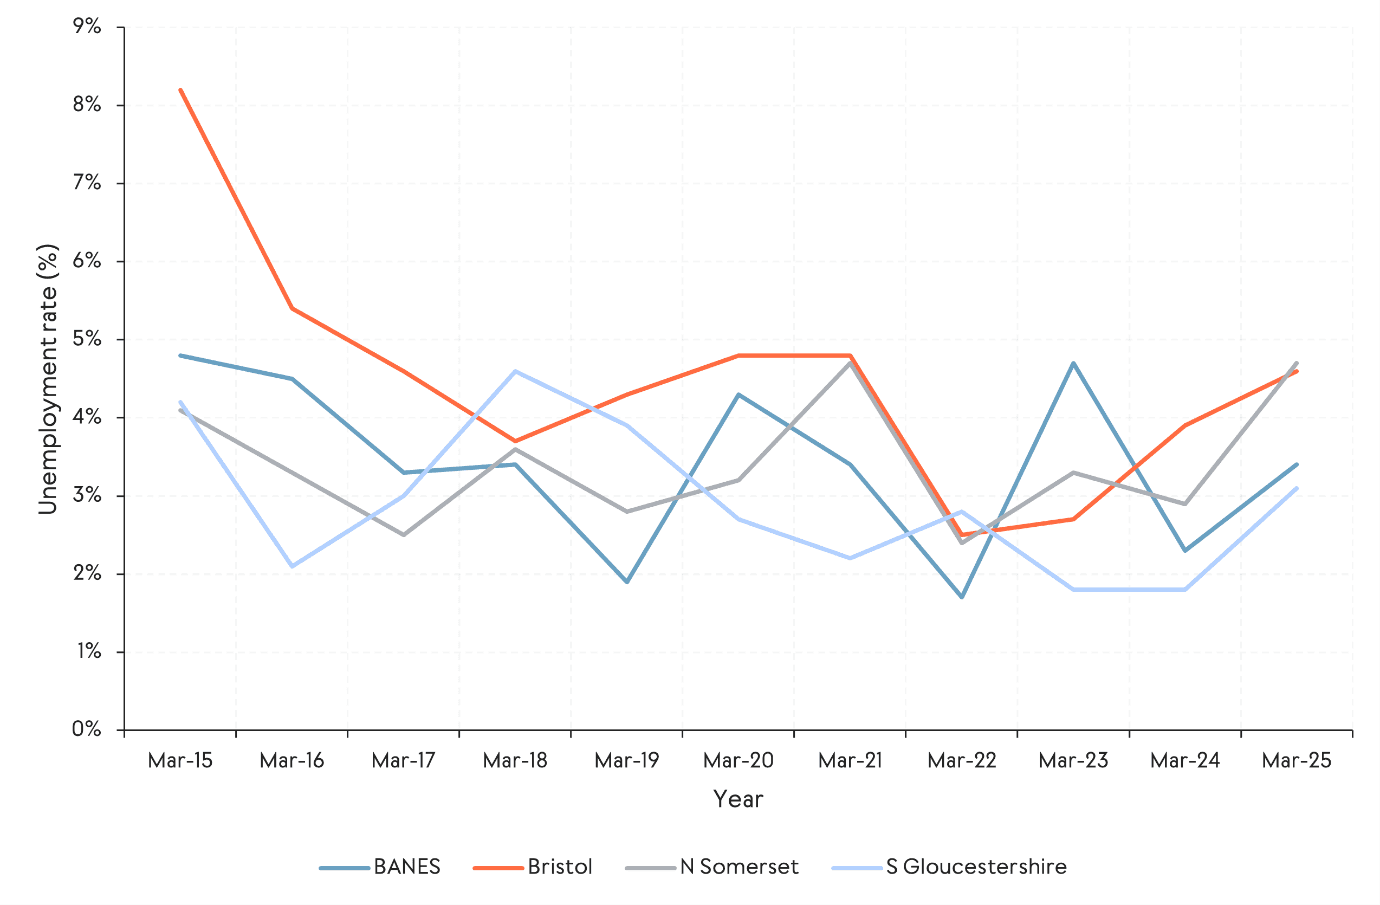
Local trends differ across the region. Bristol experienced the largest long-term decline in unemployment, falling from around 8% in 2015 to under 3% in 2023, before rising again to just under 5% in 2025. In contrast, Bath and North East Somerset, North Somerset and South Gloucestershire have generally fluctuated between 2% and 5% over the same timeframe, and typically remain below the rates recorded in Bristol (see Figure 5).
It is worth noting that subregional unemployment estimates from the Annual Population Survey have wider confidence intervals than the national data, due to smaller sample sizes. As a result, long-term trends are more reliable than year-to-year changes.
Figure 5: Unemployment rate by local authority districts in the West of England, 2015-2025
Source: ONS Annual Population Survey (03/2015-03/2025)
Figure 6: Economic inactivity and employment scatter plot by region
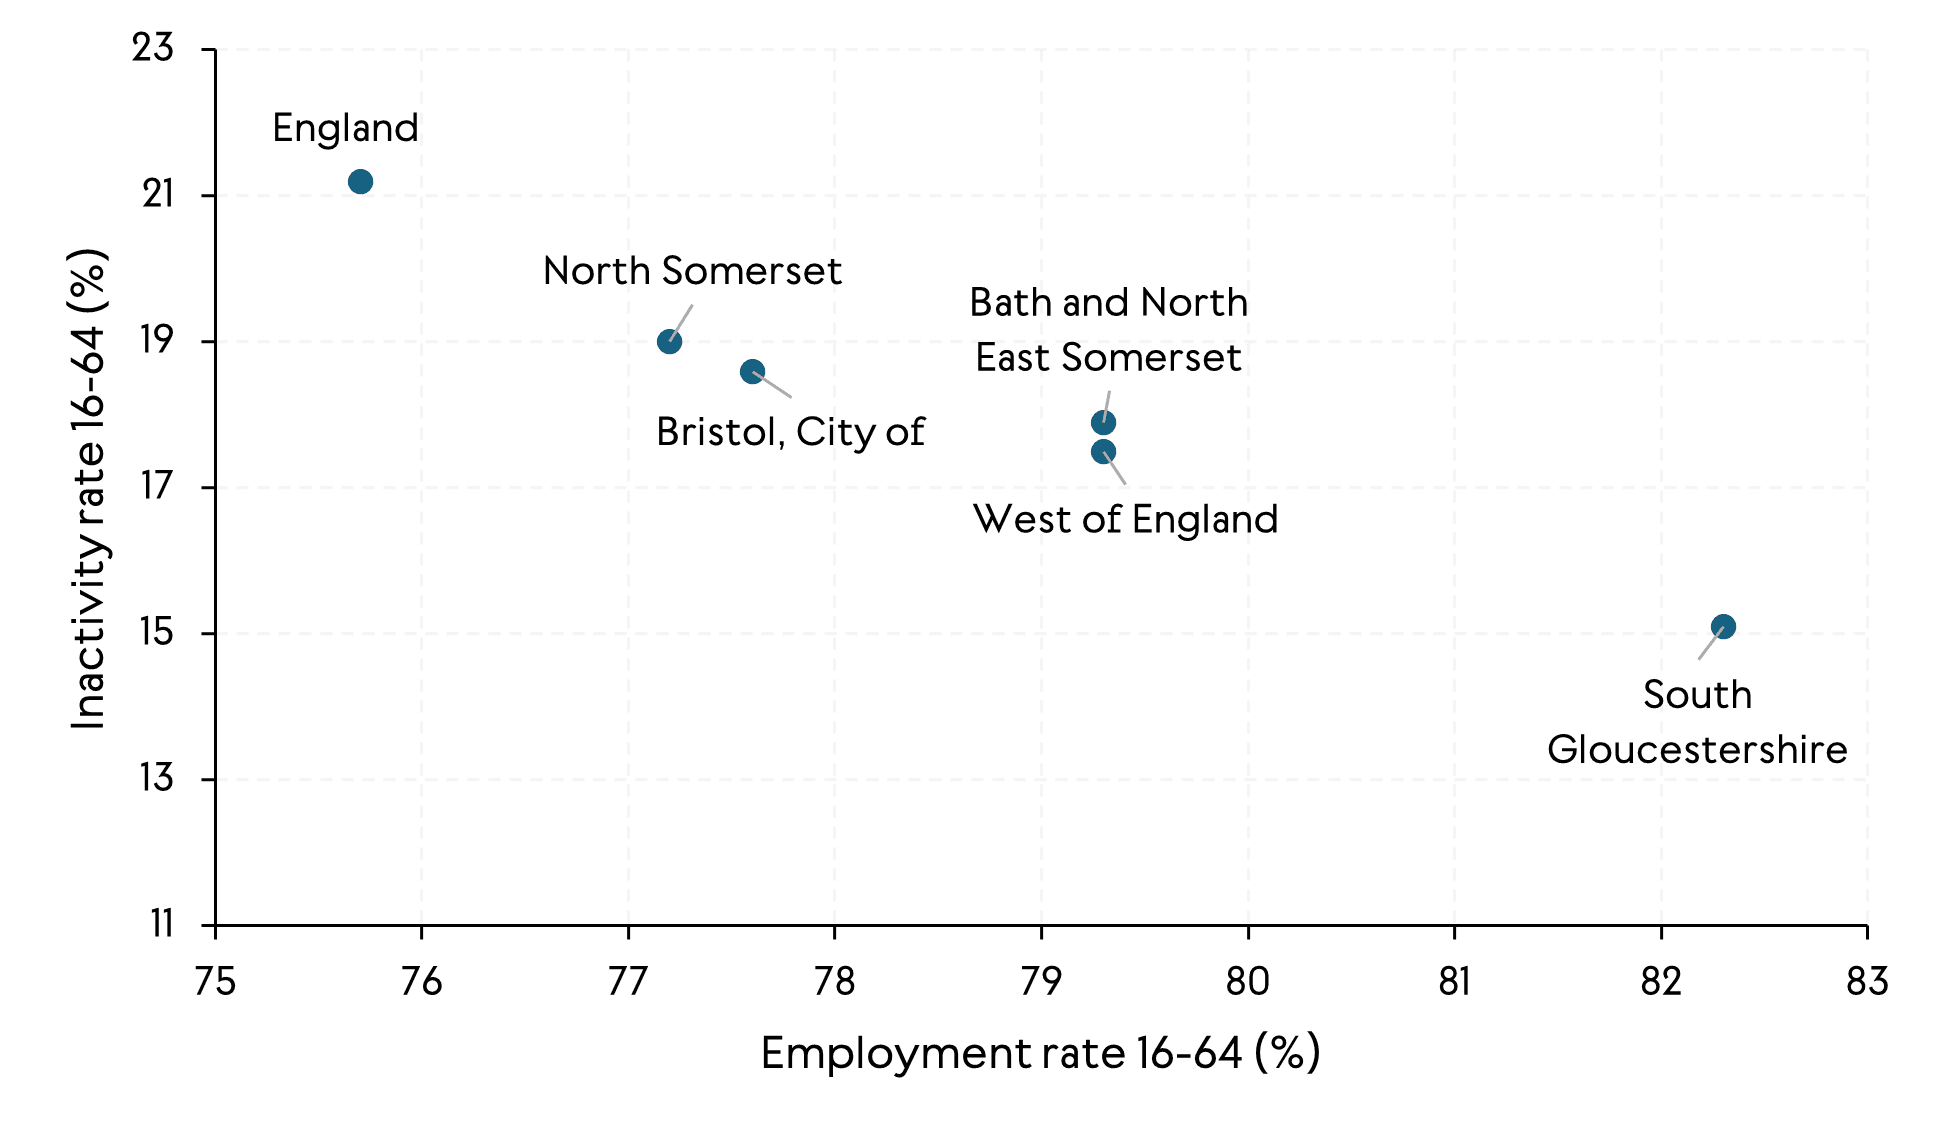
Source: ONS Annual Population Survey (03/2025)
Young people who are not in education, employment or training (NEET)
Across the West of England, NEET rates for 16- and 17-year-olds have remained relatively low overall, but trends vary significantly between local authorities (see Figure 7). Bristol shows the most notable shift, with its NEET rate rising from 2.8% in 2019 to almost 6% in 2025. The steepest increases occur after 2023, placing Bristol above the England average and signalling growing challenges in sustaining post 16 participation.
By contrast, the other three authorities present more stable trajectories. Bath and North East Somerset records the lowest NEET rate in the region and remains well-below the England average between 2019 and 2025. South Gloucestershire shows modest variation, dipping to just over 1% in 2021 before rising to 2.7% in 2025, yet still outperforming national trends. North Somerset follows a similarly steady path, tracking close to the England average until 2024, when it begins to diverge from the rising national rate.
Figure 7: Proportions of 16-17 NEET in the West of England, 2019-25
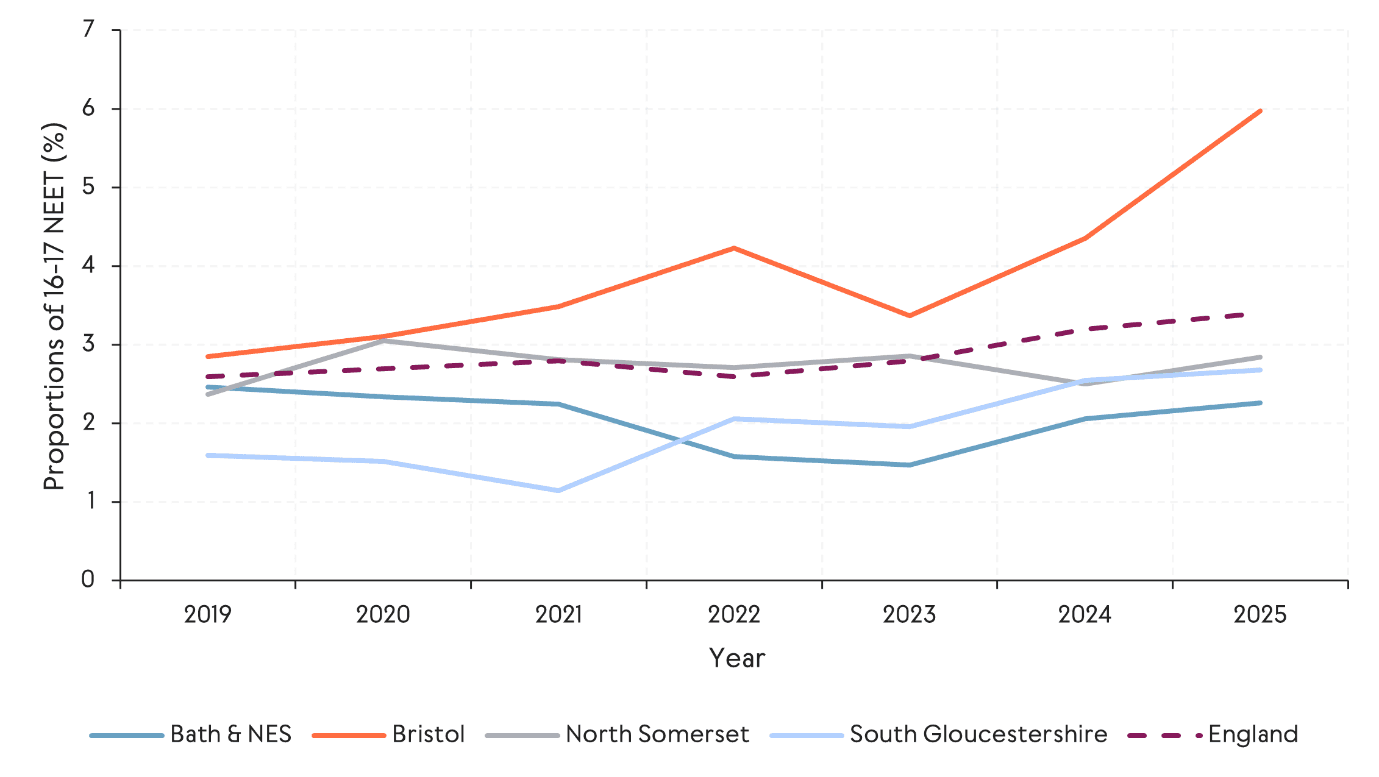
Source: National Client Caseload Information System, GOV.UK
Comparative performance of major labour market indicators
The West of England's labour market performs strongly compared with those of other combined authorities, as highlighted by better indices than most of the major metropolitan regions in measures such as employment, economic activity, labour productivity and qualifications (see Figure 8).
Figure 8: Major indicator index comparison between combined authorities (national benchmark=100)
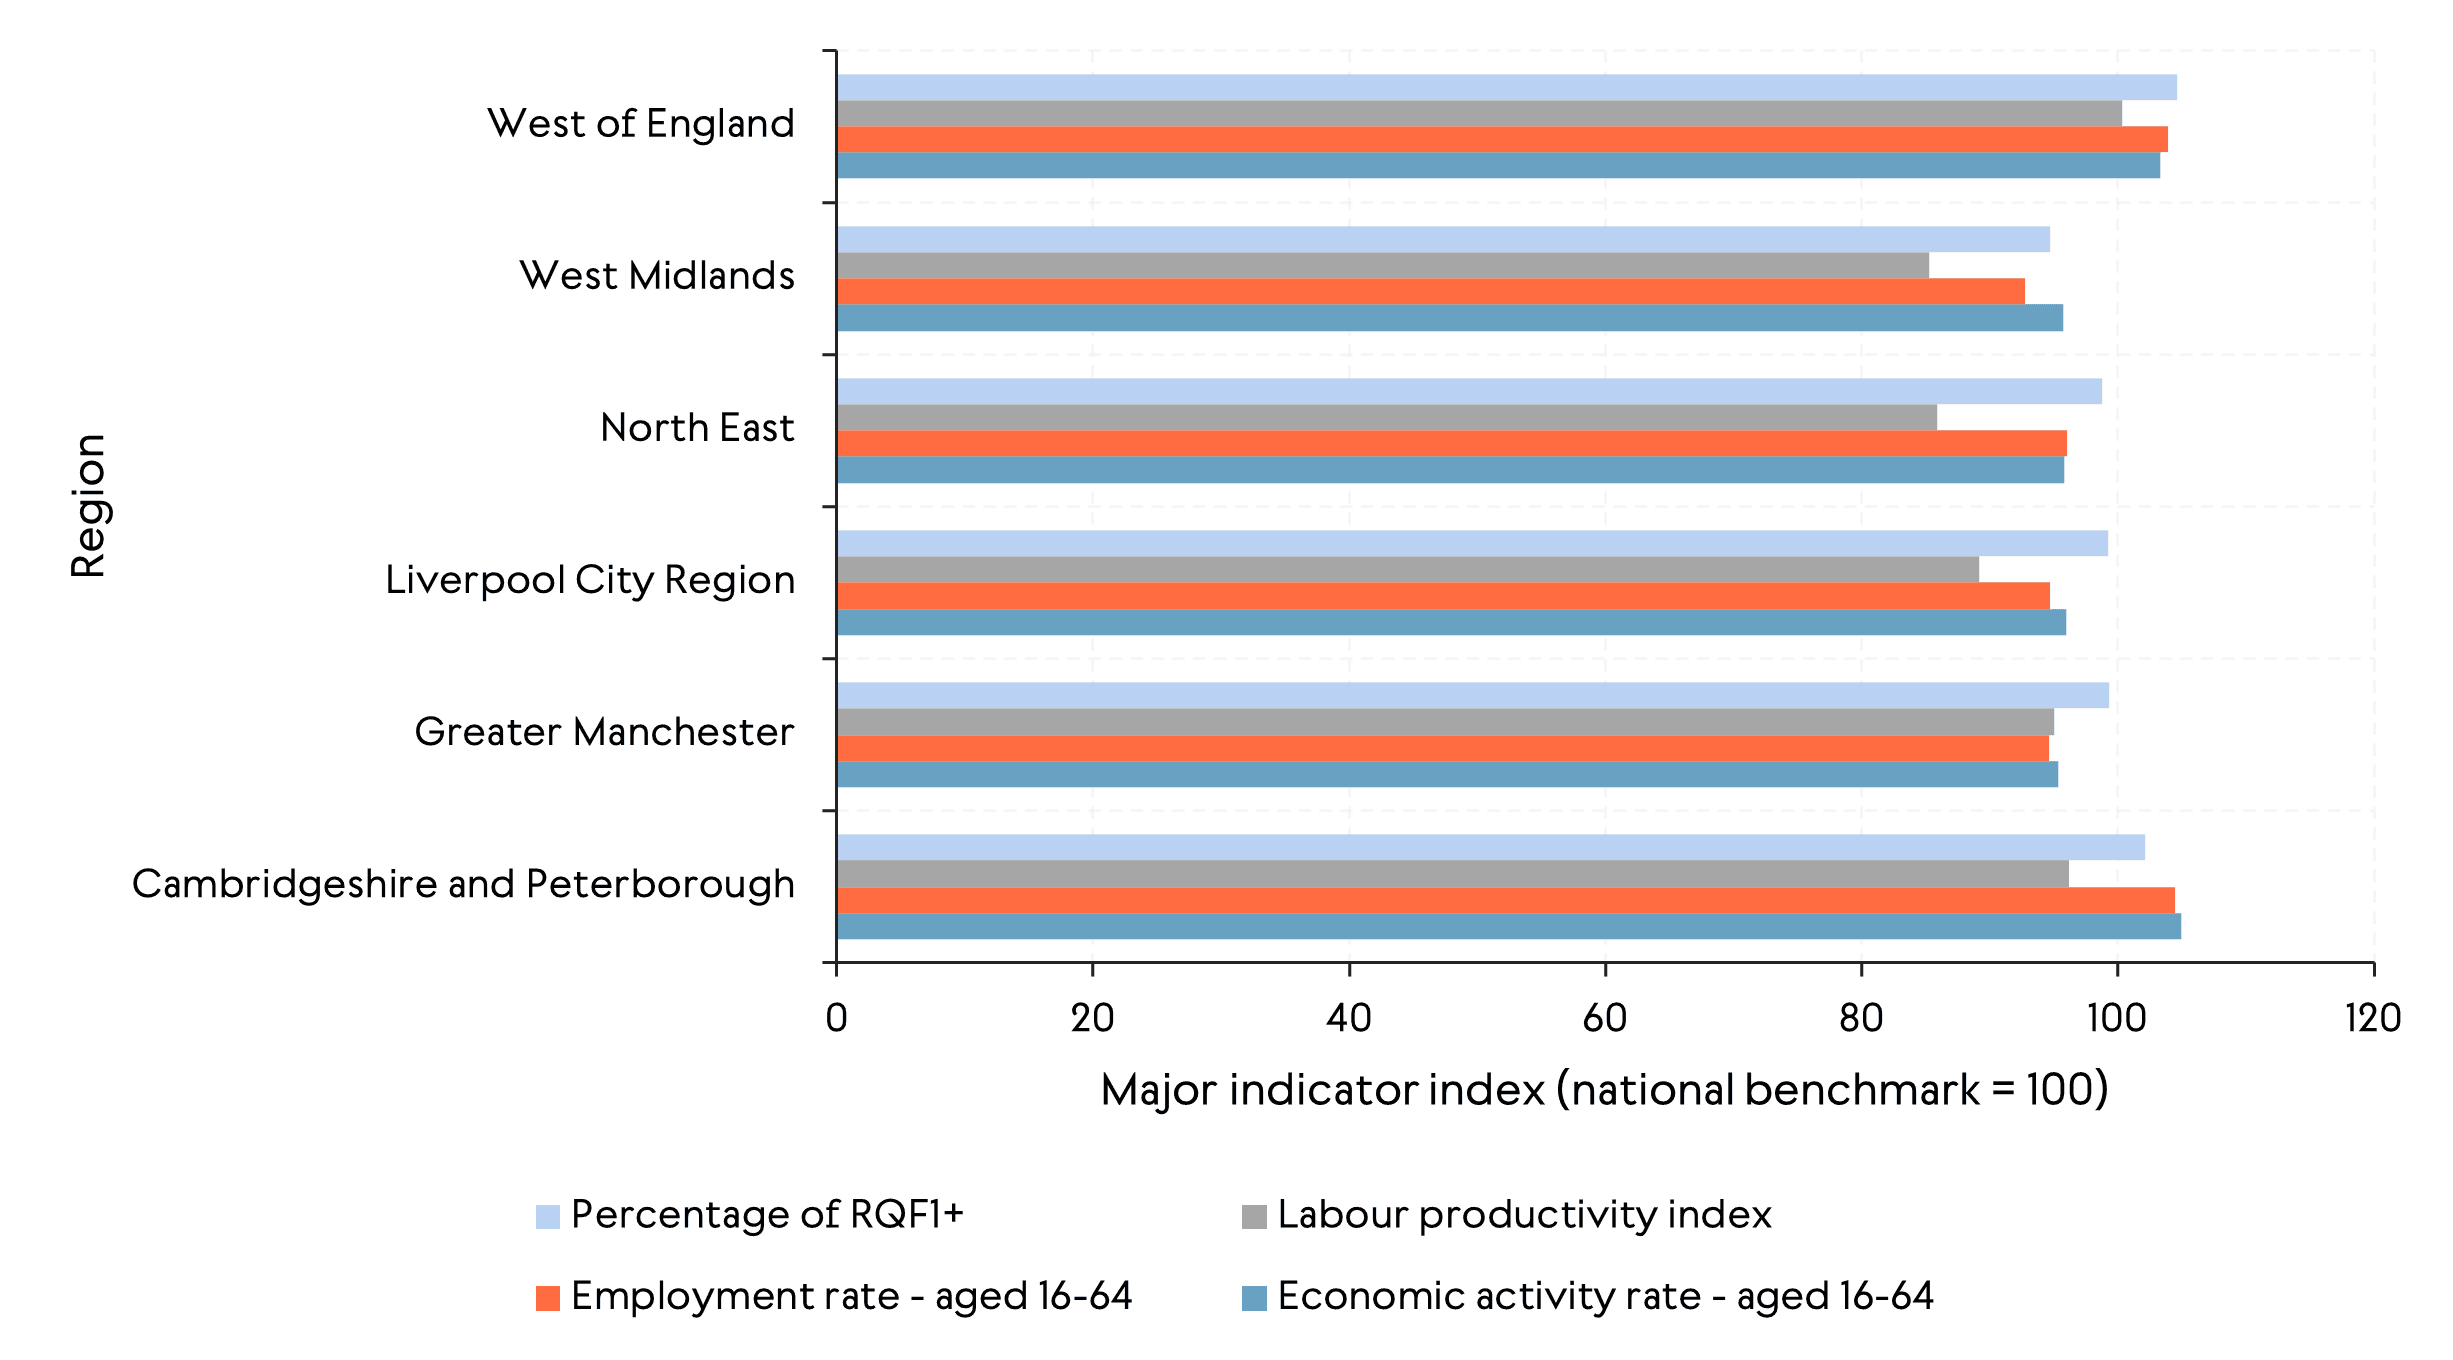
Source: ONS Subregional Labour Productivity data, Annual Population Survey, Labour Force Survey.
Labour productivity – a measure of economic output per hour worked – in the West of England is slightly above the UK average, while noting national comparisons are influenced by the exceptionally high productivity levels found in London and the home counties. ONS data for 2004-23 show that the region’s productivity index has consistently ranged between 95% and 101% of the UK benchmark.
Within the region, South Gloucestershire is the only local authority to exceed the national average, reflecting its concentration of high‑value industries. Bristol, North Somerset and Bath and North East Somerset follow in that order, each performing below South Gloucestershire but broadly in line with wider regional patterns (see Figure 9).
Figure 9: Labour productivity index for the West of England (UK=100)
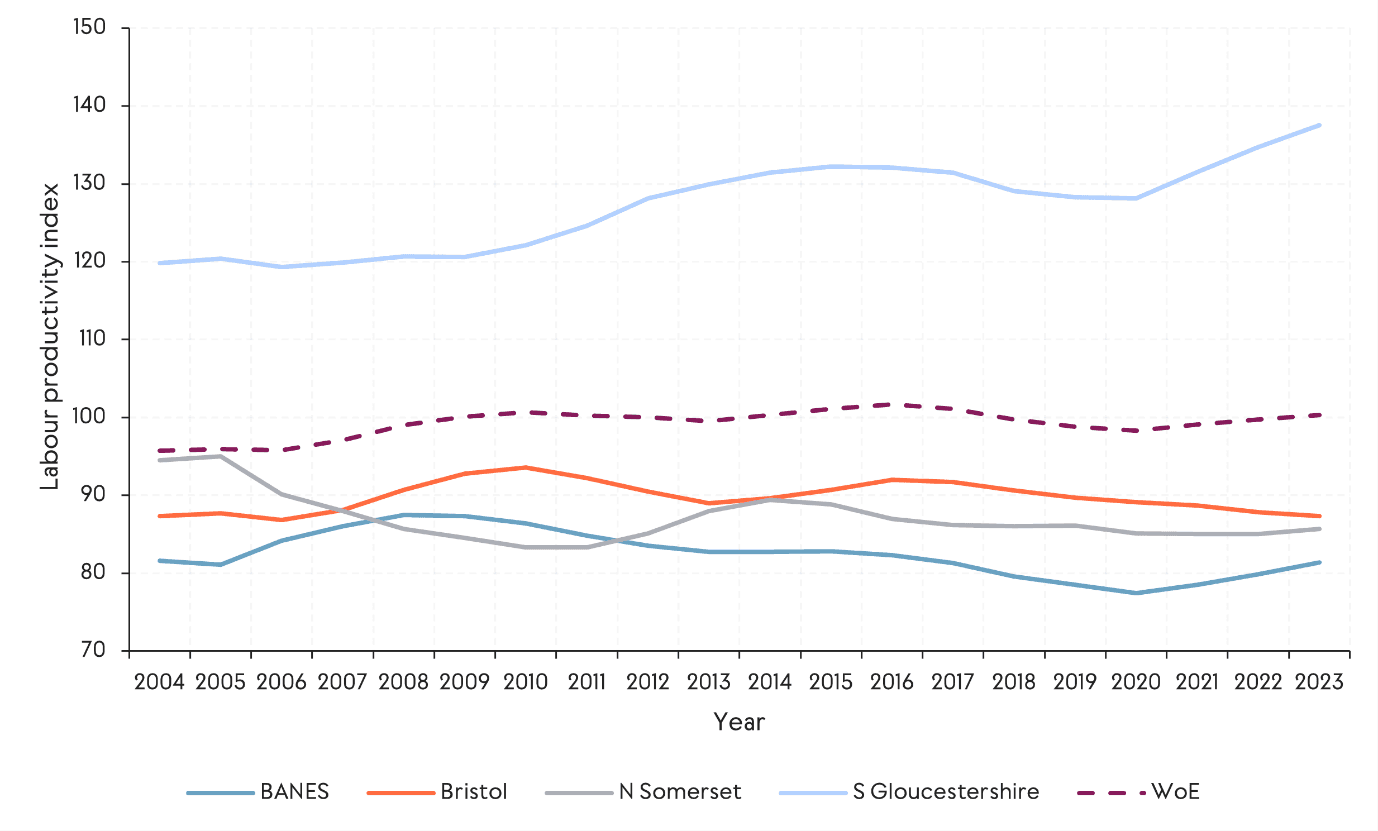
Source: ONS Subregional Labour Productivity data (2004-23), measured by gross value added (GVA) per hour worked.
Conclusion
Overall, the headline indicators point to a strong but uneven labour market in the West of England. The region regularly outperforms the national average on key measures, placing it among the most competitive regional economies. Employment rates have risen over the past decade and recovered well following the pandemic.
Beneath these positive headline figures, however, the analysis highlights important internal differences between local authorities, as well as emerging pressures. In terms of employment, South Gloucestershire performs particularly well, and while unemployment remains low overall, it is generally higher in Bristol than in surrounding authorities. Further, inactivity rates reveal structural differences in participation across places. Most notably, trends among young people show growing divergence, with NEET rates rising sharply in Bristol while remaining relatively stable elsewhere.
Taken together, the data suggest a region characterised by strong aggregate performance alongside pockets of vulnerability, underlining the importance of policies tailored to different places and inclusive labour market interventions.
References
Data sets:
Department for Education National Client Caseload Information System
ONS Labour Force Survey (03/2007-03/2024).
ONS Annual Population Survey (03/2019-03/2025)
ONS Subregional Labour Productivity data (2004-2023), measured by GVA per hour worked


