environment
economy
sustainability
Where our emissions really come from
The West of England has significantly reduced greenhouse gas emissions from a national peak in 1973, but a gap remains between business-as-usual projections and the region's net zero targets. Emissions from transport and housing stand out as key challenges for the region.
This policy insight outlines greenhouse gas emissions for the West of England region, comprised of Bath and North East Somerset, Bristol, North Somerset and South Gloucestershire. Figures are broken down by local authority and sector, highlighting the need for regional policy efforts around retrofitting and public transport.
Against reductions across the majority of sectors, emissions from transport and households remain high. As a result, enhanced policy efforts are needed in the region to accelerate housing stock retrofit programmes and to further the development of mass transit solutions. A wider national policy conversation around transport, focused on private car dependency and aviation emissions, is also necessary.
Progress on emissions reduction
The West of England’s GHG emissions profile shows a pattern of steady but gradual decline. Aviation excluded, the region has reduced emissions by 1,825 KtCO₂e [1] in the last decade (2014-2023), with reductions in domestic emissions accounting for around a third of the total (DESNZ, 2025). The West of England’s Combined Authority's (WECA’s) mitigation progress over this period is comparable with other combined authorities; only two other combined authorities had lower GHG emissions in 2023 (WECA, 2025). Nevertheless, there is still a disparity between current trends in GHG emissions and WECA’s ambition to reach net zero by 2030 – current forecasts project that a gap of 3,650 KtCO₂e will remain by the start of the next decade (see Figure 1).
Figure 1: West of England reductions in KtCO2e (historic and predicted) showing the trajectory to net zero, 2005-30
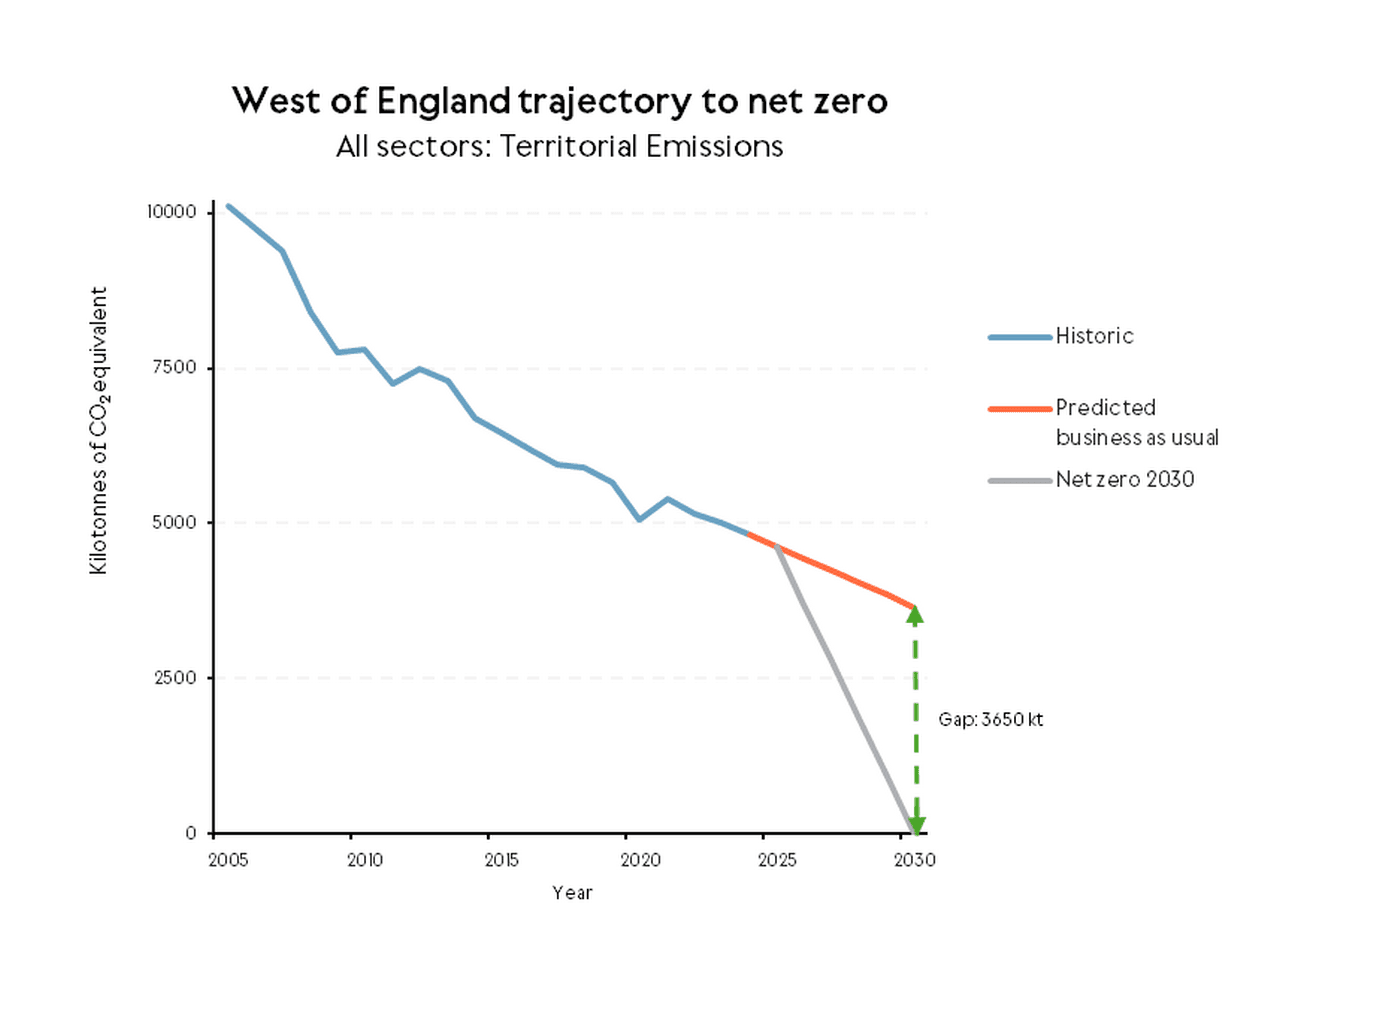
Source: DESNZ, 2025. Graph reproduced from WECA, 2025
Aviation emissions are not currently accounted for in these regional emissions figures due to their exclusion from international mitigation pledges. The UK is updating its carbon accounting scheme, and the 6th Carbon Budget (active from 2033-37) will include emissions from air transport, with corresponding increases to regional and national totals. The remaining analysis in this insight includes aviation to incorporate this upcoming change.
Greenhouse gas emissions by sector and local authority
Total estimated emissions for the West of England were 6,394 KtCO2e in 2022[2] (see Table 1). Just over half, 54%, of these were estimated to come from transport; with the majority related to road transport (32%, or 42% if air transport GHGs are excluded from the total) and air transport services (21%).
Domestic households are second, producing 20% of total emissions. Of the remaining sectors, industrial and commercial emissions make up 15% of the total, agriculture accounts for 5%, with 3% each from public sector activities and waste management.
Table 1: GHG emission profile for the West of England
Emissions allocated to sector | City of Bristol | Bath and North East Somerset | South Gloucestershire | North Somerset | West of England | |
Industry electricity | 34 | 12 | 37 | 17 | 101 | |
Industry gas | 11 | 4 | 49 | 84 | 148 | |
Large industrial installations | 1 | 0 | 17 | 3 | 21 | |
Industry 'other' | 52 | 21 | 58 | 28 | 158 | |
Industry total | 98 | 37 | 161 | 132 | 428 | |
Commercial electricity | 149 | 38 | 88 | 50 | 324 | |
Commercial gas | 93 | 23 | 47 | 24 | 187 | |
Commercial 'other' | 19 | 7 | 9 | 7 | 42 | |
Commercial total | 261 | 68 | 143 | 81 | 553 | |
Public sector electricity | 28 | 13 | 14 | 9 | 64 | |
Public sector gas | 68 | 30 | 13 | 12 | 123 | |
Public sector 'other' | 10 | 2 | 8 | 3 | 23 | |
Public sector total | 106 | 46 | 34 | 24 | 211 | |
Domestic electricity | 129 | 61 | 85 | 67 | 343 | |
Domestic gas | 330 | 154 | 204 | 169 | 856 | |
Domestic 'other' | 8 | 19 | 27 | 20 | 75 | |
Domestic total | 467 | 234 | 317 | 256 | 1274 | |
Road transport (A roads) | 133 | 105 | 143 | 83 | 464 | |
Road transport (motorways) | 73 | 0 | 437 | 215 | 726 | |
Road transport (minor roads) | 307 | 127 | 255 | 193 | 882 | |
Diesel railways | 8 | 8 | 10 | 7 | 33 | |
Air transport services |
|
|
| 1310 | 1310 | |
Transport 'other' | 8 | 4 | 12 | 16 | 40 | |
Transport total | 529 | 243 | 858 | 1825 | 3455 | |
Net emissions: forestry | -4 | -18 | -20 | -28 | -69 | |
Net emissions: cropland mineral soils under land use capability (LUC) | 0 | 7 | 11 | 2 | 20 | |
Net emissions: grassland mineral soils under LUC | -1 | -12 | -16 | -11 | -40 | |
Net emissions: settlements | 7 | 5 | 9 | 6 | 27 | |
Net emissions: peatland | 0 | 0 | 2 | 11 | 13 | |
Net emissions: bioenergy crops | 0 | 0 | 0 | 0 | 0 | |
Net emissions: other land use, land-use change, and forestry (LULUCF) | 0 | 0 | 0 | 0 | 0 | |
LULUCF net emissions | 3 | -19 | -13 | -20 | -49 | |
Agriculture electricity | 0 | 1 | 2 | 3 | 6 | |
Agriculture gas | 0 | 0 | 0 | 3 | 4 | |
Agriculture 'other' | 0 | 9 | 14 | 18 | 42 | |
Agriculture livestock | 3 | 67 | 82 | 70 | 222 | |
Agriculture soils | 1 | 18 | 22 | 16 | 57 | |
Agriculture total | 5 | 96 | 120 | 110 | 331 | |
Landfill | 75 | 4 | 16 | 28 | 123 | |
Waste 'other' | 26 | 9 | 22 | 10 | 67 | |
Waste total | 100 | 13 | 39 | 38 | 190 | |
Grand total | 1570 | 717 | 1660 | 3757 | 6394 | |
Population ('000s, mid-year estimate) | 479 | 196 | 295 | 219 | 1189 | |
Per capita emissions (tonnes of carbon dioxide equivalent, tCO₂e) | 3 | 4 | 6 | 17 | 5 | |
Area (km2) | 235 | 351 | 536 | 391 | 1514 | |
Emissions per km2 (ktCO₂e) | 7 | 2 | 3 | 10 | 4 | |
Conclusion
The West of England is continuing to reduce GHG emissions, yet business-as-usual projections indicate that the region will fall short of its 2030 net zero target.
Transport and households remain two significant emitters and should be the target of decarbonisation efforts. These are discussed further in the following policy insights: ‘Decarbonising road transport by 2023: What net must mean now’, ‘Aviation’s growing share: risks and regional opportunity’, and ‘Homes first: closing the retrofit delivery gap’.
Footnotes
[1] Different greenhouse gases have different warming effects and remain in the atmosphere for different durations. To provide a unified account of the total warming effect, their impact is converted into a comparable amount of CO₂. For instance, methane has a higher warming effect but a shorter lifespan than CO₂. This is expressed in equivalent terms as a CO₂e of ~80, meaning that every unit of methane has the same warming effect as 80 units of CO₂.
[2] 2022 figures are used throughout as the most recent year for which comprehensive data are available.
References
DESNZ (2025). UK local authority and regional greenhouse gas emissions statistics, 2005 to 2023. London: DESNZ. Available at: https://www.gov.uk/government/statistics/uk-local-authority-and-regional-greenhouse-gas-emissions-statistics-2005-to-2023 Accessed 11.11.2025.
WECA (2025). State of the West of England. Evidence for the Growth Strategy. Available at: https://www.westofengland-ca.gov.uk/wp-content/uploads/2025/11/State-of-the-West-of-England-2025.pdf Accessed: 03.12.25


