inequality
wages
economy
Income insecurity and poverty in the West of England
While the West of England's economy performs relatively well compared with England averages, growing and uneven levels of poverty in the region indicate high levels of inequality.
This policy insight examines income insecurity and poverty across the West of England. The analysis focuses on trends in child poverty at local authority level, using data from the Department for Work and Pensions and the Office for National Statistics. It distinguishes between absolute low income, which reflects purchasing power relative to a fixed historical baseline, and relative low income, which measures income relative to contemporary median living standards. It additionally utilises Trussell Trust’s food parcel distribution statistics to indicate household-level economic stress and gaps in social protection and service provision.
‘Stagnant incomes, combined with high inflation, have led to a sharp rise in the number of people in the UK living in households with an income of less than 60% of the median income of 2010-11 adjusted for inflation, known as absolute low income. As the cost of living has increased, the quantity of goods and services that households can afford has fallen, pushing some into poverty. Examining the concentration of poverty in the West of England allows us to assess whether the benefits of the region's strong economic performance are being shared evenly across the region.
Bristol has the highest child poverty rates on both absolute and relative measures, driven by income inequality, high housing costs and concentrated urban deprivation. Nearby local authorities have lower overall poverty levels but are seeing rises in absolute poverty, indicating households' growing financial strain.
Child poverty rates within the region
Children in low-income households are commonly measured using both absolute and relative poverty indicators. Absolute lo’w income refers to children living in households with an income below a fixed threshold anchored to a historical baseline. By contrast, relative low income refers to children living in households with an income below a contemporary median income in a given year. Examining both measures provides a comprehensive assessment of child poverty, distinguishing between worsening material hardship and widening inequality.
Across the West of England, child poverty varies sharply between local authorities, revealing significant spatial inequalities. Bath and North East Somerset (9.9%), South Gloucestershire (10.6%) and North Somerset (12.7%) all report rates of absolute low income that are substantially below the England average (19.1%) in 2023-24. However, Bath and North East Somerset and North Somerset have worsening trends, suggesting that financial pressures on families are increasing, despite relatively low overall rates. This indicates that economic vulnerability is not confined to traditionally deprived areas but is beginning to affect a broader cross-section of households.
Bristol reports the highest absolute low income rate in the region, with 19.8% of children living in absolute low income households; this is above the national average and continuing to rise. These figures indicate that nearly one in five children in Bristol are growing up in households experiencing real material deprivation, highlighting a significant concentration of hardship within the city.
A similar but more pronounced pattern is evident when examining relative low income, which reflects inequality in relation to prevailing living standards. Bath and North East Somerset (11.6%), South Gloucestershire (12.7%) and North Somerset (15.0%) all remain below the England average (22.1%) and show no statistically significant change, indicating relative stability.
Bristol again stands out when looking at this measure, with 23.0% of children living in relative low-income households; higher than the national average and continuing to increase. This indicates that child poverty in Bristol is characterised by both material deprivation and deepening inequality, with lower-income families falling further behind the regional norm.
Families in low income in the West of England
Across the West of England, the number of people living in absolute low income has risen sharply since the mid-2010s, reflecting broader national trends of stagnating real incomes and rising living costs (Department for Work and Pensions, DWP, 2024a; Office for National Statistics, ONS, 2024). In 2014-15, around 40,900 children across the West of England were living in families below the absolute poverty line; by 2023/24 this had risen to over 51,000, an increase of more than 10,000 children in under a decade (DWP, 2024b).
Bristol accounts for the largest share of this change, with the number of children in absolute low income rising from 15,378 in 2014-15 to 20,151 in 2023-24 — an increase of nearly 5,000 individuals. North Somerset shows similarly substantial growth, from 15,945 to 19,682, while South Gloucestershire rose from 5,902 to 7,267. Bath and North East Somerset saw the smallest increase from 3,685 to 3,987 over the same period (DWP, 2024b).
A temporary decline in poverty during 2020-21 aligns with national evidence showing that emergency COVID-19 pandemic measures – including furlough and temporary increases to Universal Credit – reduced immediate income shocks (ONS, 2022).
The rebound by 2023-24 demonstrates that these protections did not translate into sustained improvements in household financial resilience. Instead, the persistence and growth of absolute poverty reflect longer-term structural pressures, including rising housing costs, inflation and weak real wage growth (Joseph Rowntree Foundation, 2024)
Child poverty has significant long-term implications for regional economic resilience. Growing up in low-income households is strongly associated with poorer educational outcomes, worse health and reduced employment opportunities later in life.
Persistent poverty therefore risks reinforcing cycles of disadvantage and limiting social mobility across generations. Addressing income insecurity is essential not only for improving current living standards but also for supporting inclusive and sustainable economic growth in the West of England.
Looking at food insecurity as an additional indicator of vulnerability
Food bank usage in an area can be an effective indicator signalling household-level economic stress and gaps in social protection and service provision. This data also is more reactive and can identify pressures before they fully materialise in formal welfare statistics.
Food parcel distribution shows pronounced and persistent spatial inequality within the West of England. While total parcel volumes have risen across all authorities since 2018 – following national patterns relating to the pandemic and cost-of-living shocks – per-capita and per-site measures reveal much sharper divergence (see Figure 1).
Bristol and North Somerset consistently record high parcels-per-site values and often exceed the West of England combined figure. This pattern indicates sustained high throughput and suggests that pressure is concentrated into a limited number of sites.
Figure 1: Food parcels per site, operational pressure and capacity
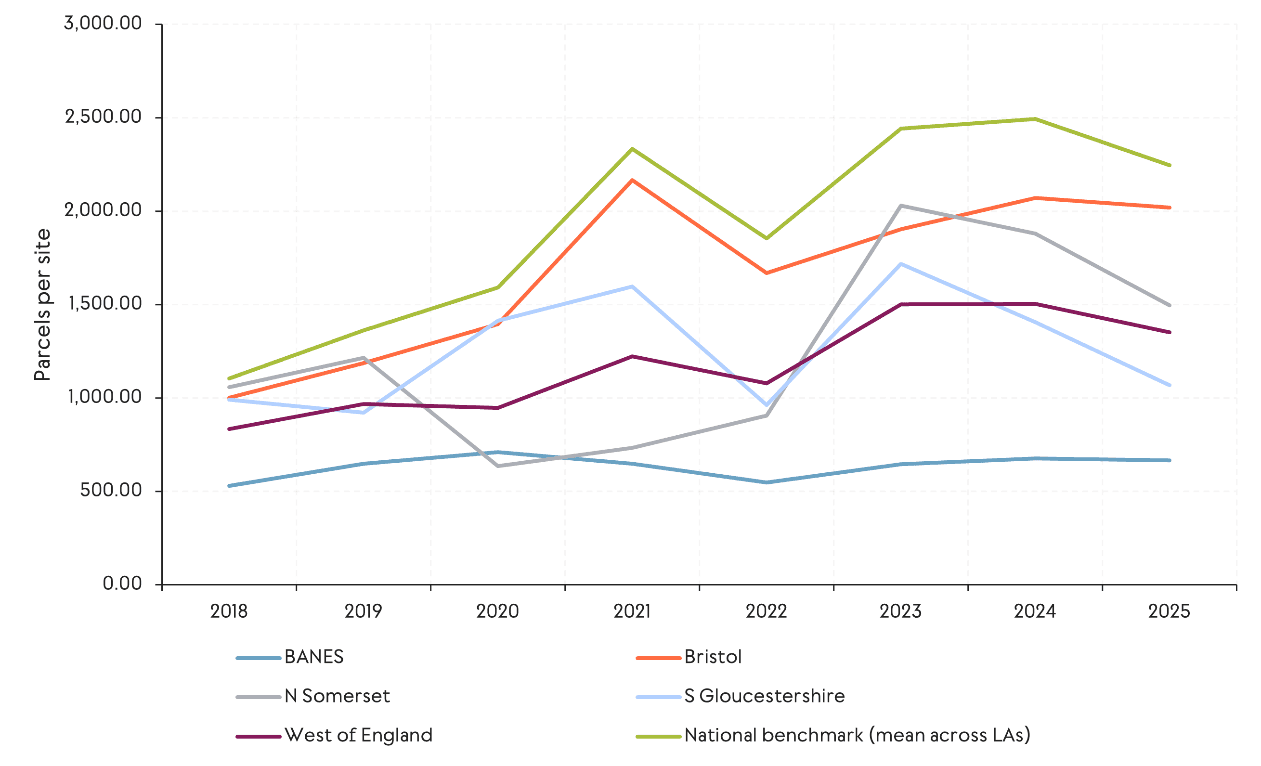
Source: (Trussell Trust, 2025)
Standardising by population clarifies the geography of per-capita need. Bristol and North Somerset similarly emerge as consistently high-intensity authorities, exceeding both the national ‘mean local authority’ benchmark and the West of England combined series in much of the period. In contrast, South Gloucestershire shows persistently lower parcels per 1,000 residents (see Figure 2).
Figure 2: Food parcels per 1,000 population, regional inequality in per-capita need
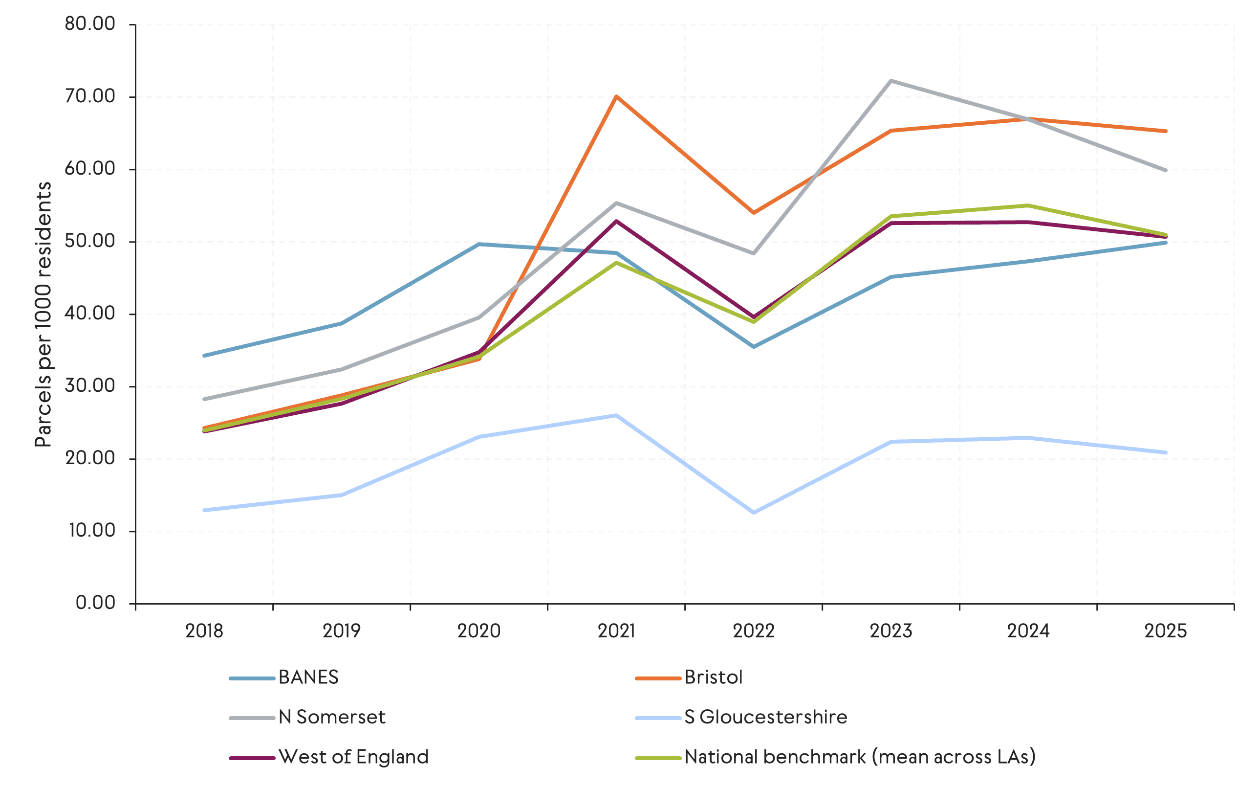
Source: (Trussell Trust, 2025)
Conclusion
There are concerning structural inequalities within the West of England. Bristol consistently experiences the highest levels of child poverty in the region – across both absolute and relative measures – reflecting the combined effects of income inequality, housing affordability pressures and concentrated urban deprivation.
Additionally, food bank usage within Bristol is rising at a faster rate than other local authorities, showing the highest usage figures within the West of England in both the per-capita and per-site figures. This suggest that food insecurity outcomes are shaped not only by macro-economic shocks but also by local conditions, including labour market structure, housing costs, welfare access, and delivery practices.
Neighbouring local authorities report lower overall poverty levels than Bristol, but recent increases in absolute poverty in some areas suggest growing financial pressure on households. The divergence between absolute and relative measures also illustrates how economic conditions are deteriorating in different ways- through declining purchasing power and widening inequality.
The divergence between absolute and relative measures is important as rising absolute poverty indicates worsening conditions, while elevated relative poverty reflects increasing inequality. These trends suggest that economic growth within the West of England has been unevenly distributed and that significant numbers of children, particularly in Bristol, have limited opportunity to benefit from the region’s economic success.
References
Department for Work and Pensions (2024a) Households Below Average Income (HBAI): 1994/95 to 2023/24. London: DWP. Available at: https://www.gov.uk/government/statistics/households-below-average-income
Department for Work and Pensions (2024b) Children in low income families: local area statistics. London: DWP.
Joseph Rowntree Foundation (2024) UK Poverty 2024. York: JRF. Available at: https://www.jrf.org.uk/uk-poverty-2024-the-essential-guide-to-understanding-poverty-in-the-uk
Office for National Statistics (2024) Household income and inequality, UK. Newport: ONS. Available at:
https://www.ons.gov.uk/peoplepopulationandcommunity/personalandhouseholdfinances/incomeandwealth
Office for National Statistics (2022) Effects of COVID-19 on household income. Newport: ONS.
Trussell Trust. (2025). End-of-year statistics on emergency food parcel distribution 2017–2025. Retrieved from https://www.trussell.org.uk/news-and-research/latest-stats/end-of-year-stats


