economy
employment
occupation
The shape of work in the West of England
The West of England is characterised by a relatively stable and highly-skilled workforce. But access to good-quality work is unevenly distributed across the region, pointing to divergences in the labour market.
This policy insight looks at the workforce structure of the West of England (Bath and North East Somerset, Bristol, North Somerset and South Gloucestershire) across different sectors, occupations, and working patterns, whilst also looking at job quality. It examines how workforce structure varies across the region and how this compares to the England average.
Data on the West of England's labour market reveals a widening divergence in access to good-quality work. The data shows the region has a large concentration of high-skill jobs, which is distributed unevenly across the region. Job quality indicators between 2012 and 2024 show South Gloucestershire has consistently performed strongly, while Bristol has improved markedly and North Somerset has lagged behind. This reinforces the need for place-based labour-market interventions within the region that are responsive to local economies, promote inclusion and support job quality.
What we do for work: West of England's workforce by sector and occupation
Examining workforce structure by sector and occupation is essential for understanding what types of jobs underpin headline labour-market outcomes. This perspective reveals the extent to which employment is concentrated in higher- or lower-wage activities, helps identify skills mismatches and vulnerabilities to economic change.
Across the West of England, public administration, education and health employ the largest volume of people, totalling 35.4% of the workforce (higher than England average of 32.5%). Banking, finance and insurance is next with some 22% of the workforce (also higher than England average of 19.1%), while distribution, hotels and restaurants follow with 11.8% (lower than England average of 15.6%) (see Figure 1).
Figure 1: Employment by sector by local authority
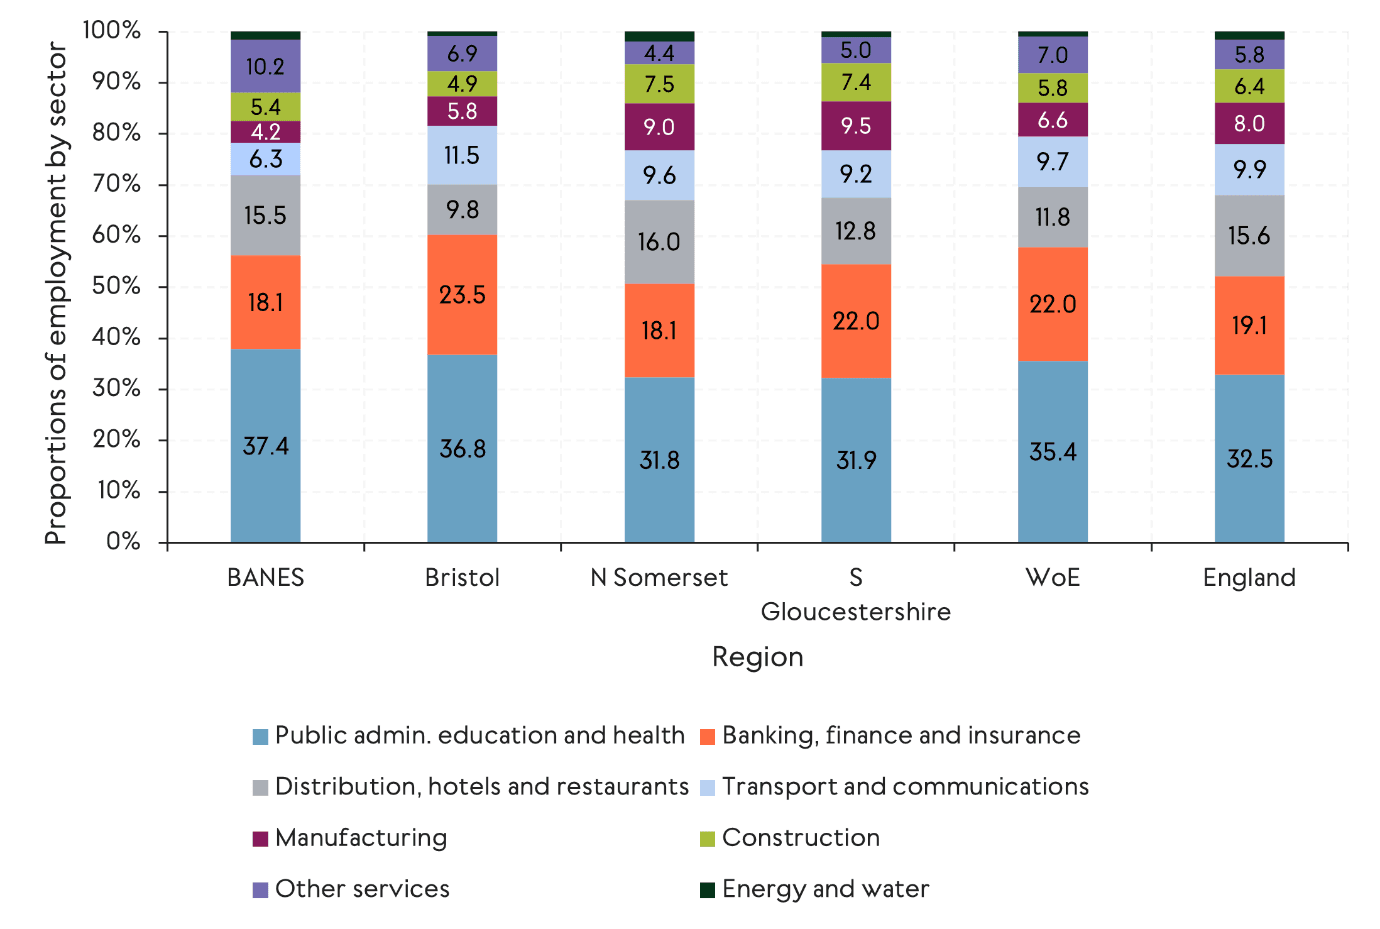
Source: Office for National Statistics (ONS) Annual Population Survey, 03/2025
How do these shares differ within the West of England?
Bath and North East Somerset has the highest share of public administration, education and health sector jobs (37.4%) of the four local authorities in the region. Bristol stands out for finance (23.5%) and transport and communications (11.5%), while North Somerset leads in distribution, hotels and restaurants (16%). South Gloucestershire leads in manufacturing (9.5%), while also having a relatively high share of employees in the finance sector (22%). Both North Somerset and South Gloucestershire have relatively high shares of employment in construction (around 7.5% compared with the West of England average of 5.8%) and manufacturing (around 9% versus the West of England average of 6.6%).
The relative comparison between the proportion of jobs in England and the proportion of jobs in the West of England by sector is shown in Figure 2. The 45-degree line represents identical values for the two variables. Values above the 45-degree line show that a sector accounts for a larger proportion of jobs in England than in the West of England, and vice versa for sectors below the 45-degree line. The further the industry is away from the line, the greater the difference.
Figure 2: Location quotient chart by industry - West of England and England average
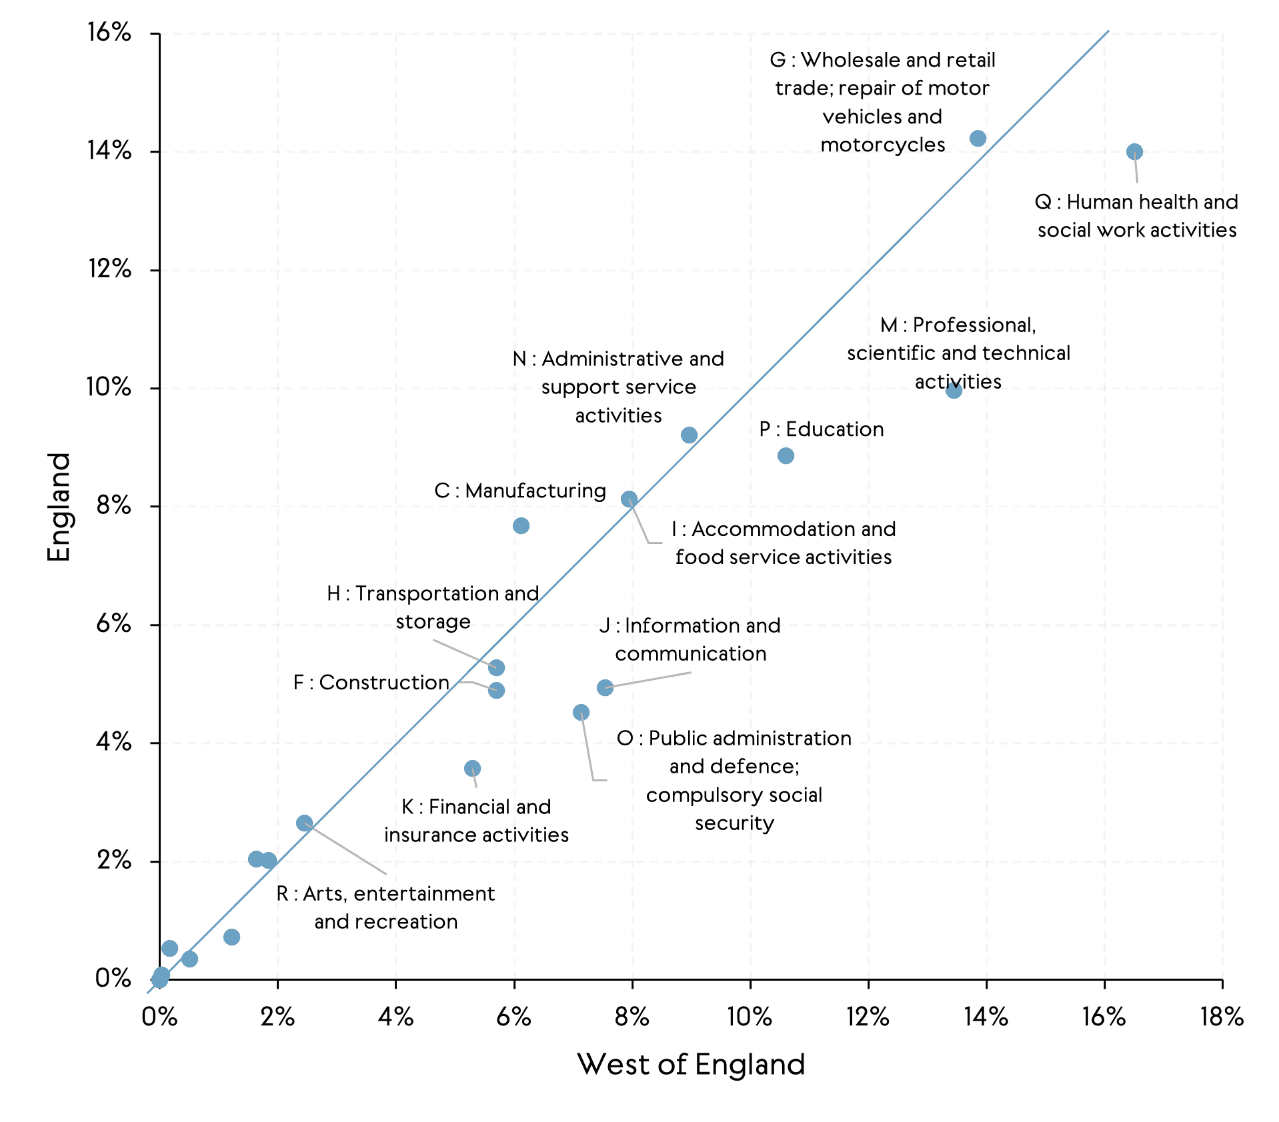
Source: Business Register and Employment Survey (BRES) data, ONS, 2024
The West of England has the highest actual density of jobs in human health and social work activities (>16). Whereas the greatest difference in density between the West of England and the average for England as a whole is in professional, scientific and technical activities (as indicated by this sector being the furthest distance from the 45-degree line in Figure 2).
The region also has a higher density of employment in several other industries compared with the England average, including public administration and defence, information and communication, education, financial and insurance activities and construction (all below the 45 degree line).
The West of England workforce is dominated by professional occupations – over a third (35.3%) of employees are in such roles, which in the main, require a high level of knowledge and experience in areas such as the natural sciences, engineering, life sciences, social sciences, humanities and related fields[1]. This share is higher than the England average at 26.9%. What's more, there is a strong representation of associate professional roles[2] (16.4%) and managers/directors[3] (11.3%) in the region (see Figure 3).
Figure 3: Occupational structure of employment (SOC) by local authority
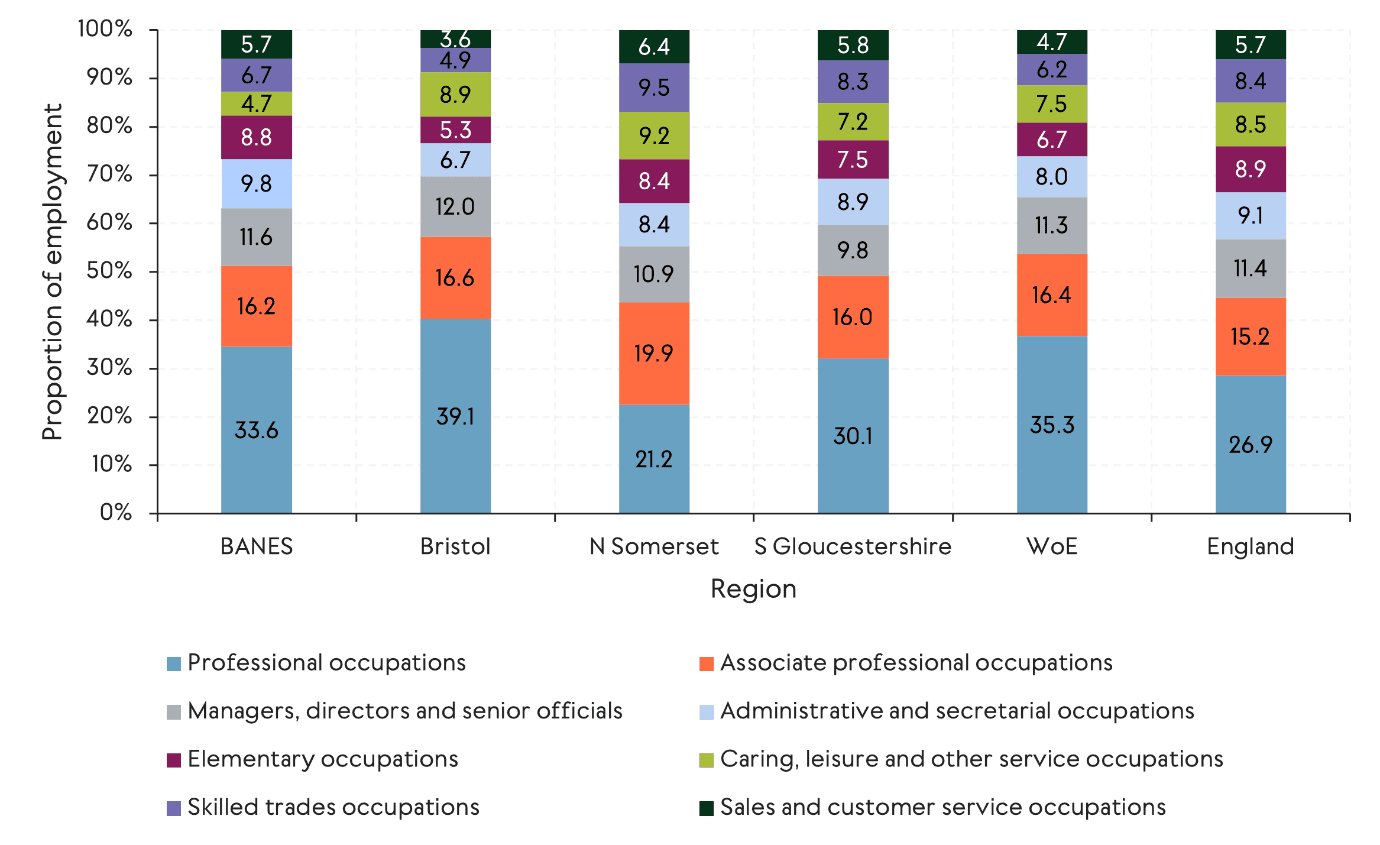
Source: ONS Annual Population Survey, 03/2025
Among the local authorities, Bristol leads in professional occupations (39.1%) and has the lowest share of elementary roles (5.3%). North Somerset has the highest proportion of associate professionals (19.9%) but fewest professionals (21.2%). Bath and North East Somerset and South Gloucestershire both have balanced profiles, each with around one-third professionals and about 10% managers. Caring, leisure and other service roles are less prevalent, representing roughly 4-7% of the workforce in these two sub-regions.
Working patterns across the West of England
Looking at working patterns (such as full-time versus part-time work or hours worked) and characteristics of the job helps to clarify the quality and sustainability of employment, not just the quantity. These patterns provide insights into underemployment, work–life balance and how different groups participate in the labour market.
In the West of England, the proportion of full-time workers increased by approximately 4 percentage points between 2016 and 2025. The data show an increasing trend in the proportion of full-time employment from 2016 to 2019, followed by a considerable drop in 2020, likely reflecting the impact of the COVID-19 pandemic. It then peaked in 2022 before gradually declining in 2025 (see Figure 4).
In contrast, the region experienced a gradual drop in part-time employment over most of the period between 2016 and 2025. Albeit the proportion of part-time employment did start to increase marginally in 2025.
Figure 4: Percentage of the workforce in full-time and part-time employment in West of England by year, 2016-25
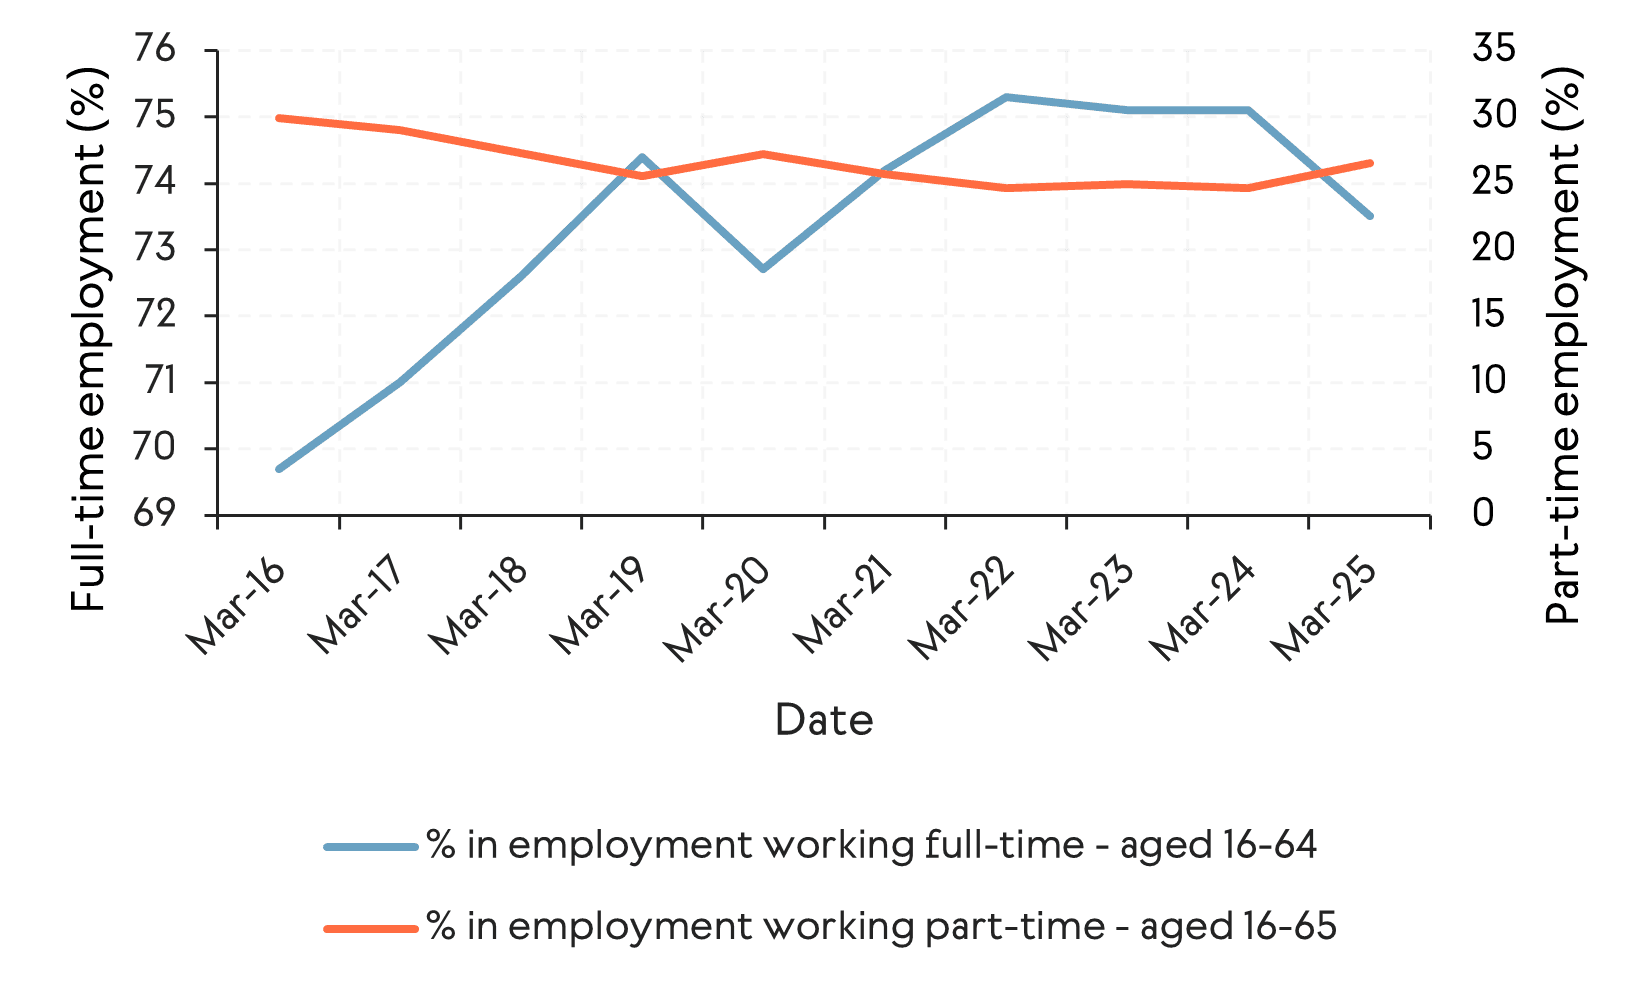
Source: ONS Annual Population Survey, 03/2016-03/2025
Employment patterns show a consistent full-time to part-time ratio across most local authority areas (see Figure 5). Just over three-quarters of England's workforce is employed full-time (77%), while the West of England records marginally lower levels (74%). This ratio remains relatively stable across the region, with one exception: Bath and North East Somerset has a notably higher share of part-time workers (35%).
Figure 5: Breakdown of full-time and part-time employment by region
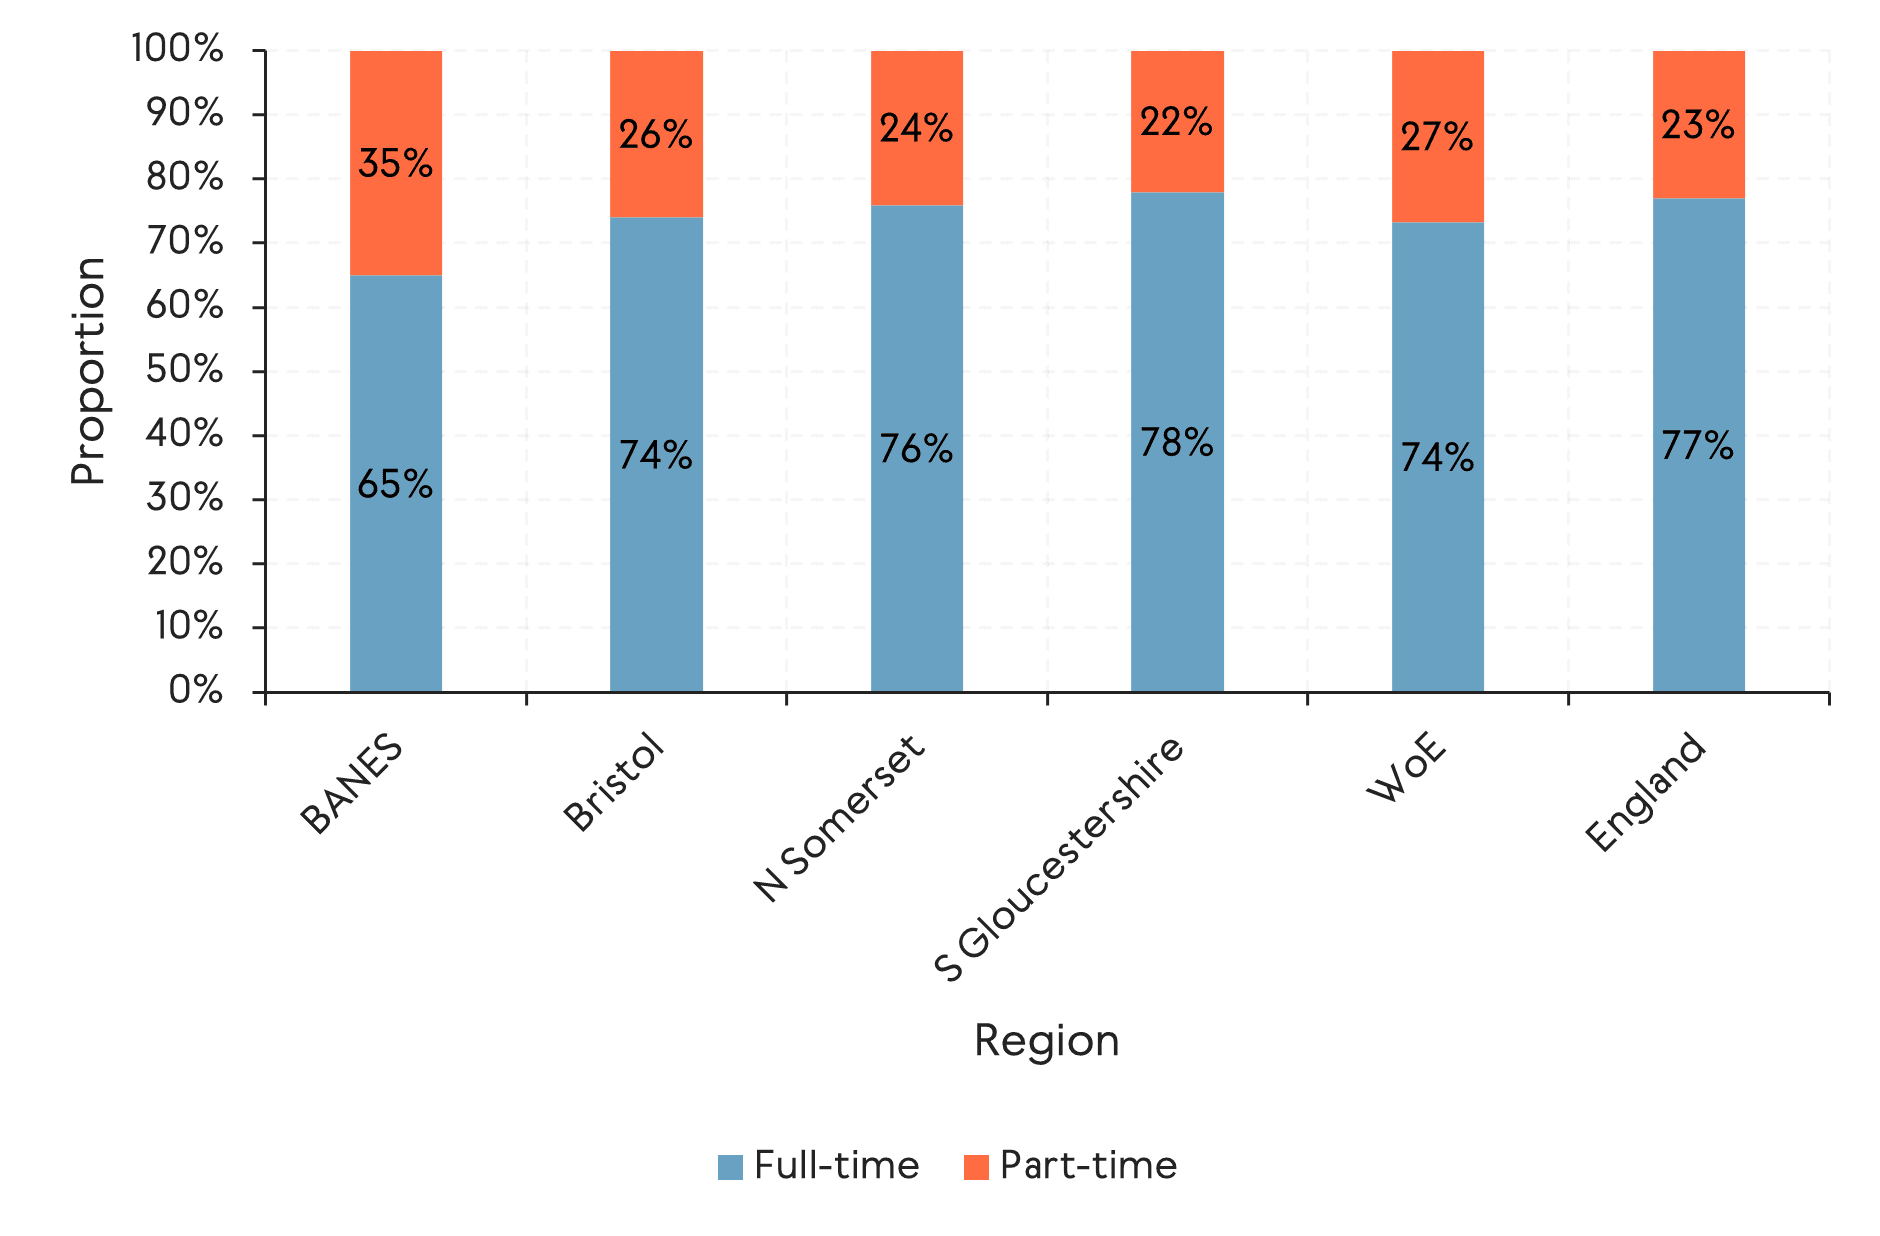
Source: ONS Annual Population Survey. 03/2025
Working hours are relatively stable across the West of England, albeit there has been a rise in the percentage of people working 35-44 hours a week (see Figure 6). This is partially offset by those working 10-34 hours and those working 45 hours or more.
Between 2016 and 2025, approximately half of the people employed in the region worked 35-44 hours per week, followed by over a quarter working 10-34 hours. Around 20% of people work 45 hours or more each week, while only a small fraction work fewer than 10 hours.
Figure 6: Working hours distribution in the West of England, 2005-24
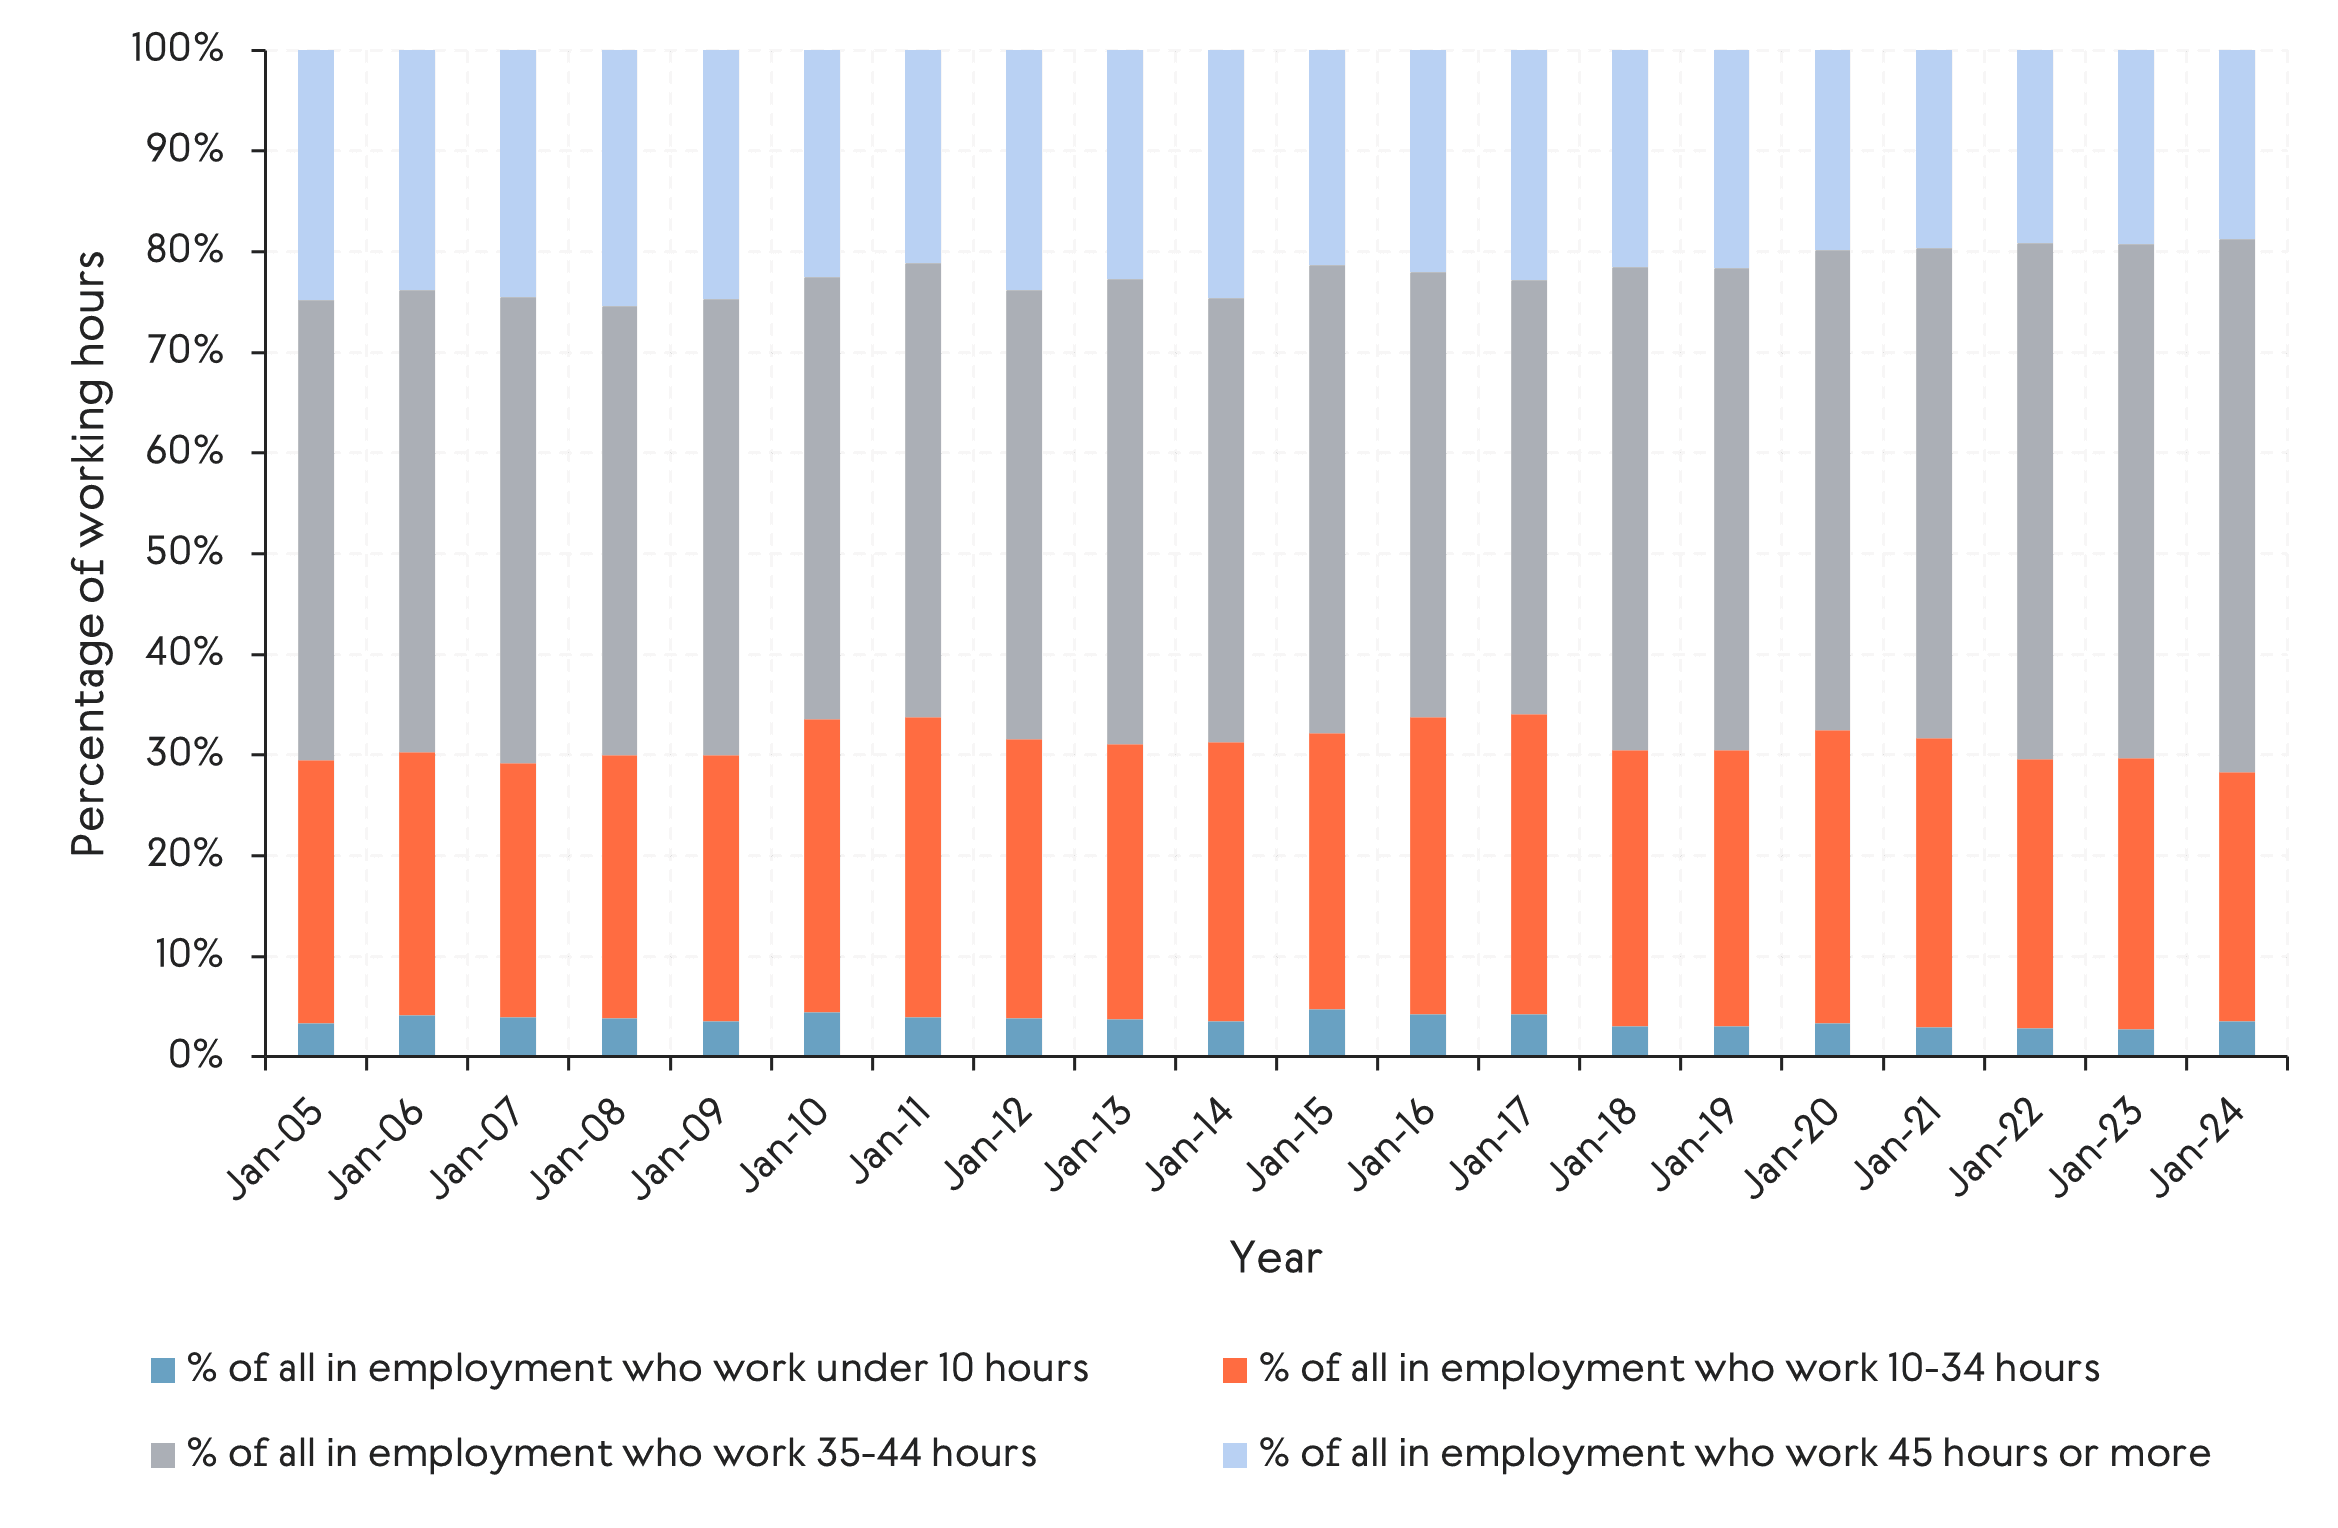
Source: ONS Annual Population Survey, 03/2005-03/2024
In 2025, the proportion of the population working up to 34 hours per week in the West of England is higher than the England average, while the share of the population working more than 34 hours per week is lower (see Figure 7). Within the West of England, the share of weekly working hours varies significantly across local authorities. Those working more than 34 hours per week is highest in South Gloucestershire and lowest in Bath and North East Somerset.
Figure 7: Working hours distribution in the West of England by local authority, 2003-25
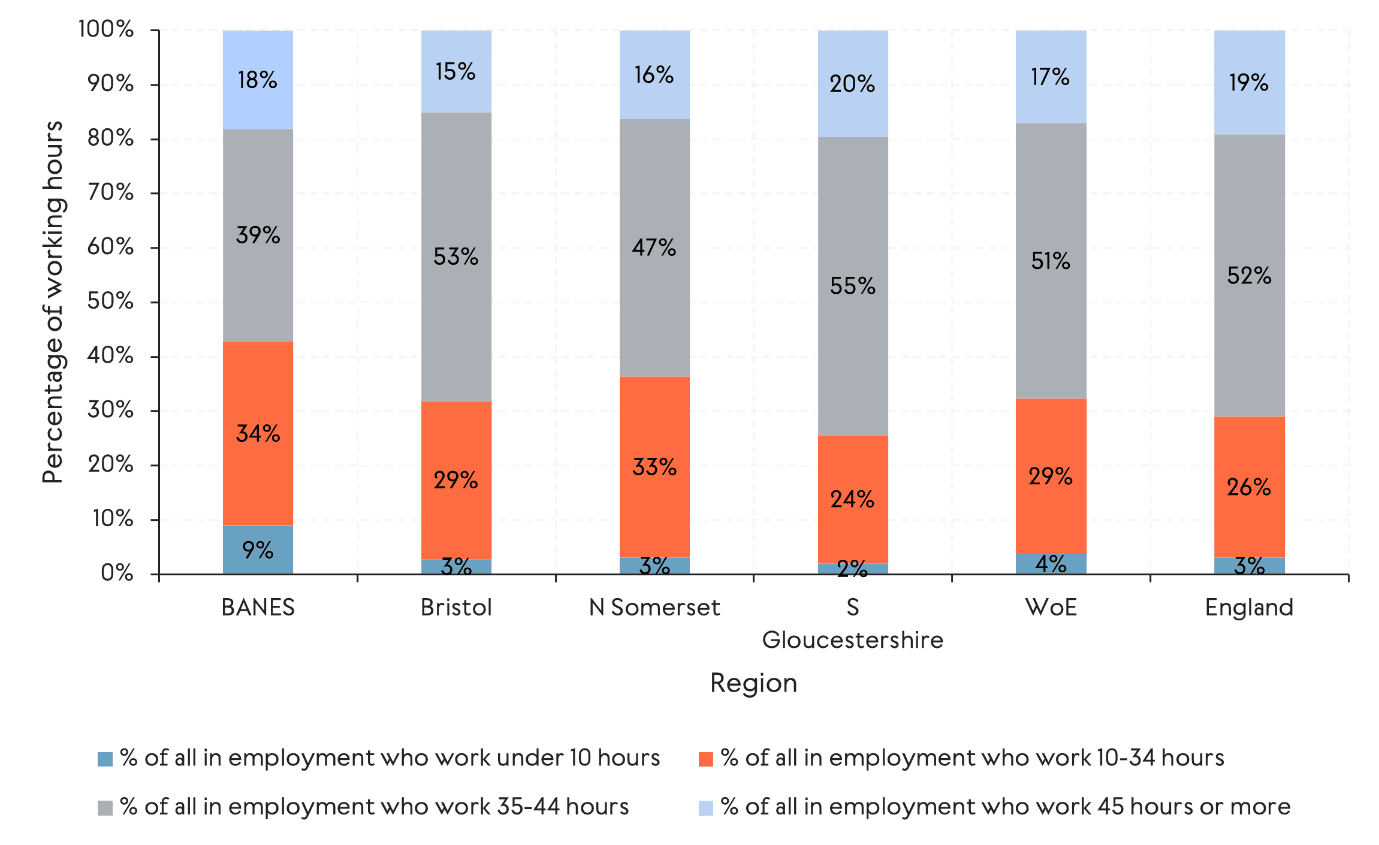
Source: ONS Annual Population Survey, 03/2025
Access to good work in the West of England
There is a consistent and widening divergence in access to good work between the four West of England local authorities between 2012 and 2024 (see Figure 8). Good work here is defined using the good work time series, a measure produced by the Institute for the Future of Work (2025) using indicators including employment, economic activity, share of professional jobs, de-routinisation of occupations, satisfactory working hours and pay. A higher score means better access to good work (i.e., better outcomes in employment, autonomy, pay and job structure); conversely, lower scores reveal weaker access and larger relative disadvantages.
South Gloucestershire has consolidated its position as a regional leader in good work since 2012. Bristol has improved significantly to exceed South Gloucestershire’s total score by 2024. Bath and North East Somerset's performance has varied over the period, albeit ranking in the bottom half throughout, while North Somerset initially improved but has fallen behind in 2024, highlighting labour-market and job-quality challenges relative to the rest of the region.
Figure 8: Good work total scores in West of England, 2012, 2016, 2020 and 2024
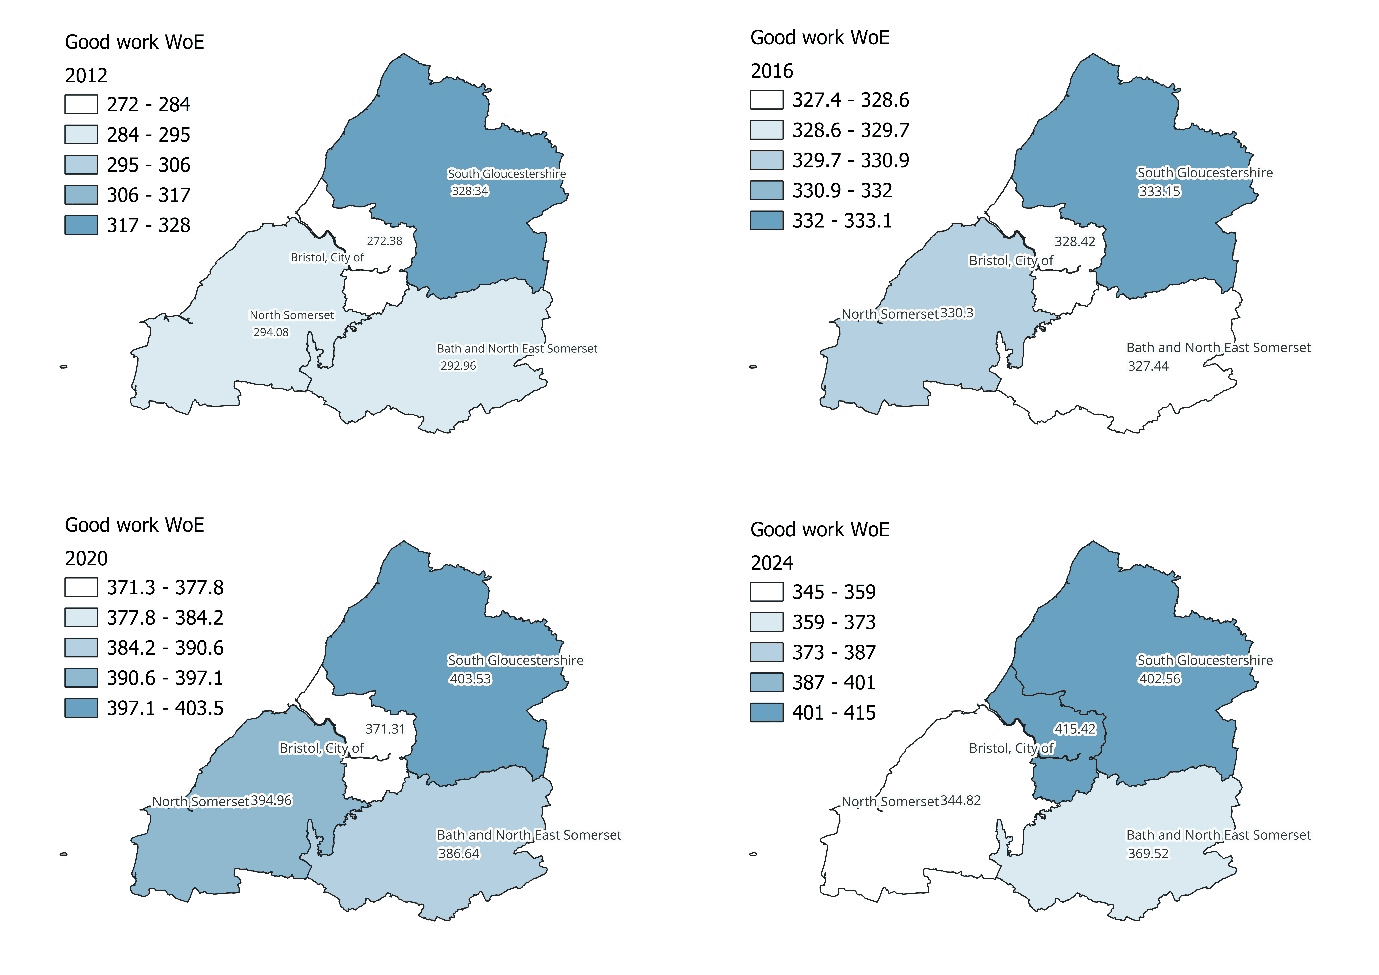
Source: The good work time series report, Institute for the Future of Work, 2025
Conclusion
The West of England has a concentration of high-skilled, professional and public-sector employment, although this does vary between local authorities. The number of professional, scientific, financial and public service activities are above the English average, however the data points to differing local specialisations, including higher shares of manufacturing and construction in North Somerset and South Gloucestershire.
Working patterns suggest that employment structures have been broadly stable over time, with a predominance of full-time work. Nevertheless, there are meaningful differences in hours and part-time employment across the region that can help to explain variations in earnings, particularly between Bath and North East Somerset and the other local authorities.
Indicators of job quality show that differences across the region are becoming more pronounced. South Gloucestershire consistently is a strong performer and Bristol has improved significantly, while North Somerset has trailed. This suggests growing disparities within the labour market and underlines the importance of targeted, place-specific strategies to enhance job quality and promote inclusivity.
Footnotes
[1] Occupations in which the main tasks require a high level of knowledge and experience in the natural sciences, engineering, life sciences, social sciences, humanities and related fields, such as teachers, scientists, health professionals, IT and business professionals.
[2] Occupations in which the main tasks require experience and knowledge of principles and practices necessary to assume operational responsibility and to give technical support to professionals, managers, directors and senior officials. Examples include engineering and science technicians; health associate professionals (such as paramedics, dental technicians); protective service occupations (for example police associates) and business and finance associate professionals.
[3] Occupations in which tasks consist of planning, directing and coordinating resources to achieve the efficient functioning of organisations and businesses such as CEO’s and corporate managers and directors.
References
Papagiannaki, E., Thomas, A., & Brewin, K. (2025, July 15). The Good Work Time Series 2025 (Good Work Time Series). Institute for the Future of Work. https://www.ifow.org/resources/the-good-work-time-series-2025


