economy
business
employment
Resilience and shocks: COVID-19, Brexit and firm-size polarisation
The West of England has shown resilience following major shocks, including COVID-19 and Brexit. Across the region, recovery has been uneven and structural challenges around inactivity and small firm vulnerability have grown.
This policy insight provides an overview of how the West of England labour market has responded to major economic shocks, specifically Brexit and the COVID-19 pandemic. Employment levels and economic inactivity are explored using both publicly available data and restricted data only available to accredited researchers for four constituent local authorities (Bath and North East Somerset, Bristol, North Somerset and South Gloucestershire).
The employment rate in the West of England fell by 0.8% per year from 2016 to 2024 due to Brexit, following the referendum on the UK’s membership of the European Union (EU), compared to the non-Brexit scenario. This accelerated after Brexit was implemented in 2021, with the employment rate decreasing by 1.2% due to Brexit, while the labour inactivity rate – a measure of those not in, or seeking work – increased by 0.5% over the following three years due to Brexit, compared to the non-Brexit scenario. These impacts are consistent with research revealing notably negative impacts of Brexit on the UK labour market (Portes, 2024; Dhingra et al., 2016).
These effects were further compounded by the COVID-19 pandemic. Employment rate estimates that explore what might have happened to labour market participation had the pandemic not happened are higher than the actual performance in the West of England from 2020 to 2024.
Before the COVID pandemic, firms with 250-499 employees experienced the highest rate of employment growth, while firms with more than 500 employees had the highest rate of turnover growth. After the pandemic, both retained a stronger performance in turnover and employment growth than firms hiring fewer employees. Turnover growth declined for firms hiring fewer than 100 employees after the pandemic.
Crucially, recovery has been uneven across local authorities, with smaller firms consistently being more adversely affected.
Employment and labour market inactivity
We estimate that the employment rate in the West of England would have been higher without the COVID pandemic (see Figure 1). Although the non-pandemic estimates from 2020 to 2024 still indicate a slowdown from the long-term trend – potentially due to restrictions on EU immigrants and economic disruptions resulting from Brexit – they are still higher than the actual performance of labour participation in West of England. It is estimated that employment rates between 2020 and 2024 would have been between 0.8 and 1.8 percentage points higher in each of the four years.
Figure 1: Employment rate West of England real data compared with non-pandemic estimates
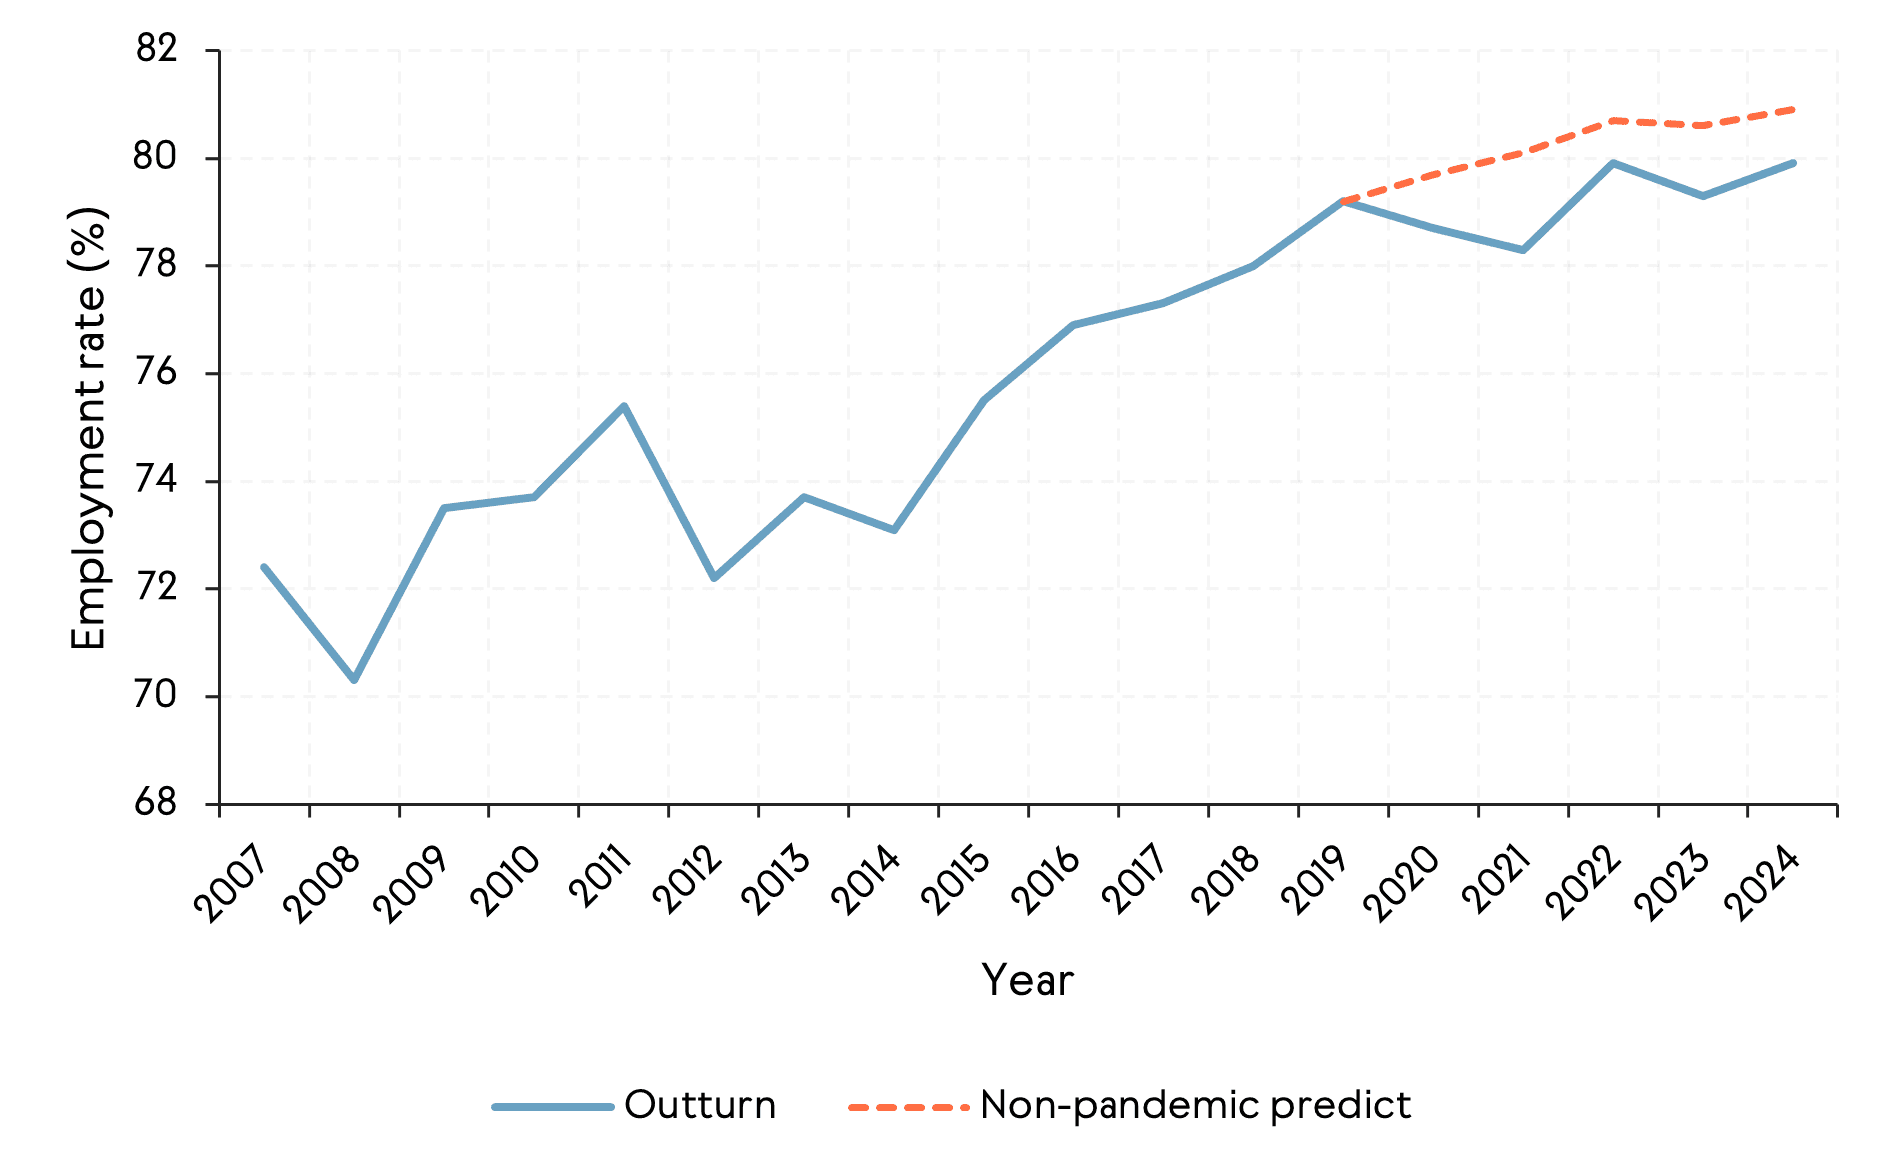
Source: Office for National Statistics (ONS) Annual Population Survey (03/2007-03/2024), Labour Force Survey (03/2007-03/2024).
Note: We use the NIGEM model developed by National Institute of Economic and Social Research (NIESR) to produce non-pandemic estimates of the employment rate.
The UK’s decision to leave the EU in 2016 resulted in changes to UK-EU single market and the right of free movement between the UK and the EU’s Schengen area. The Brexit transition year started in 2020, and the actual implementation of Brexit started on 1 January 2021.
As it is widely believed that the UK labour market has been significantly affected by Brexit, we performed fixed-effect impulse response analysis using labour market data in the West of England to test this assumption. This statistical method allowed us to estimate how the employment and inactivity rates changed over time after Brexit, helping us to understand its real impact on the West of England labour market.
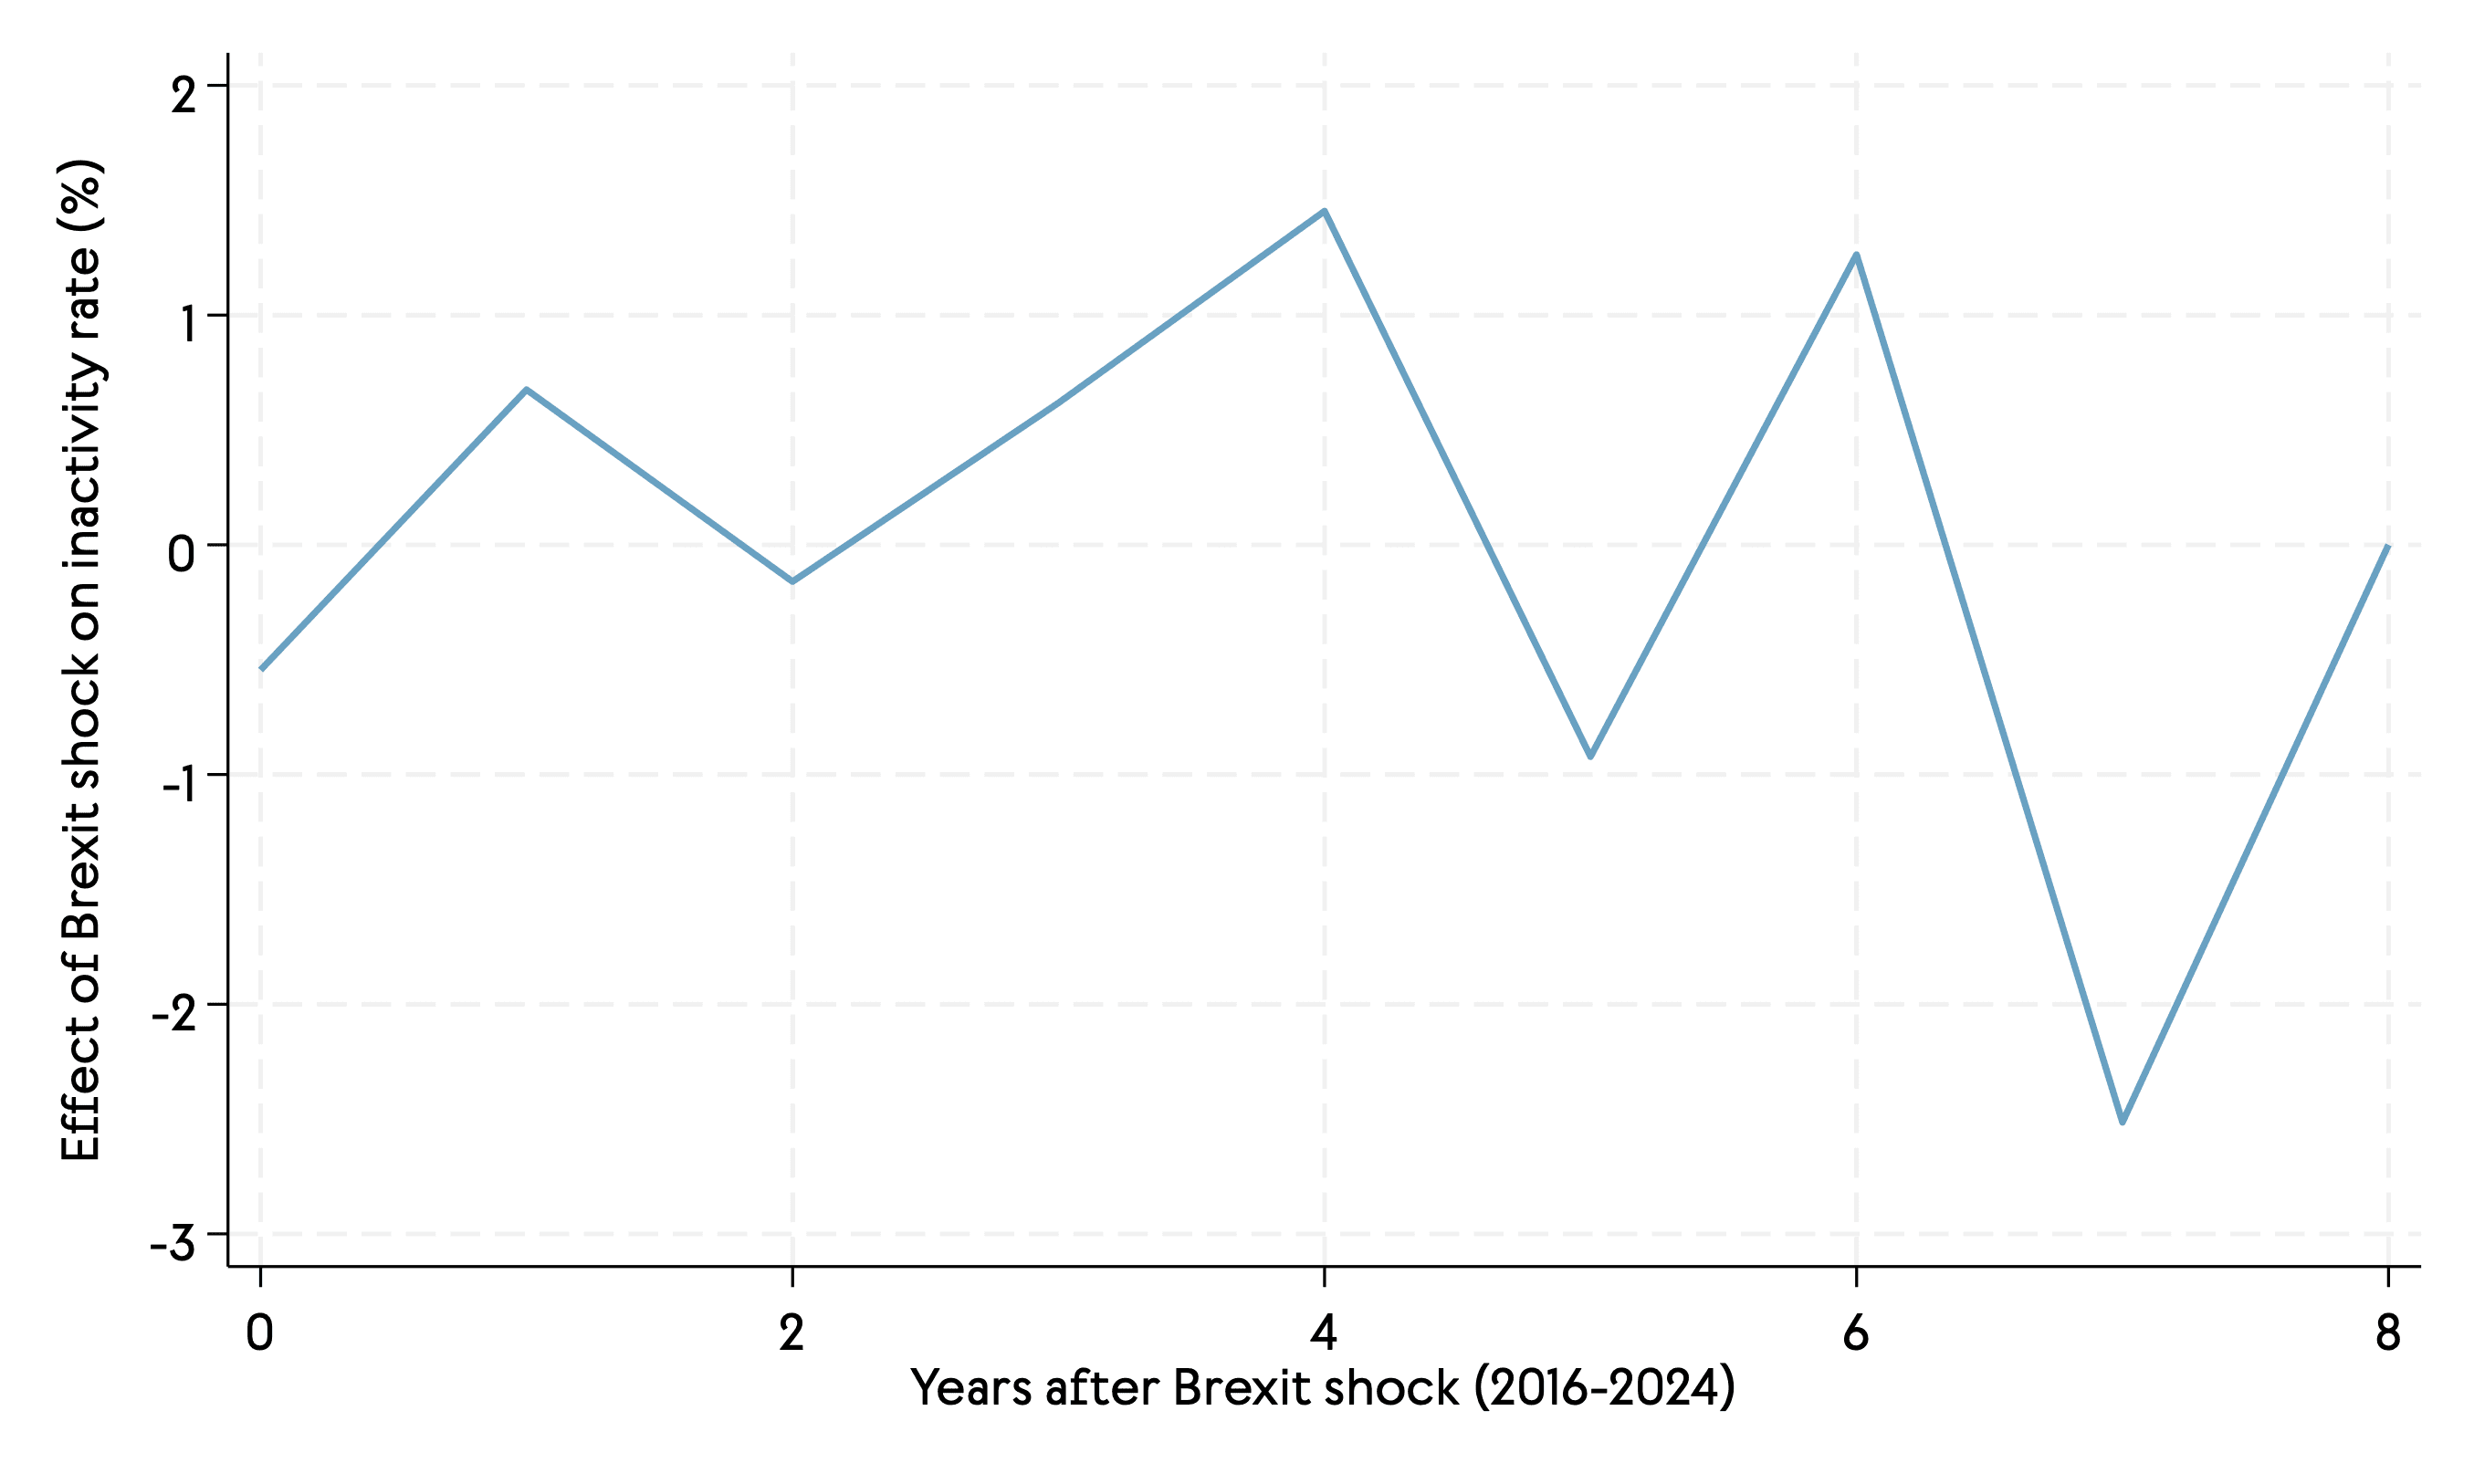
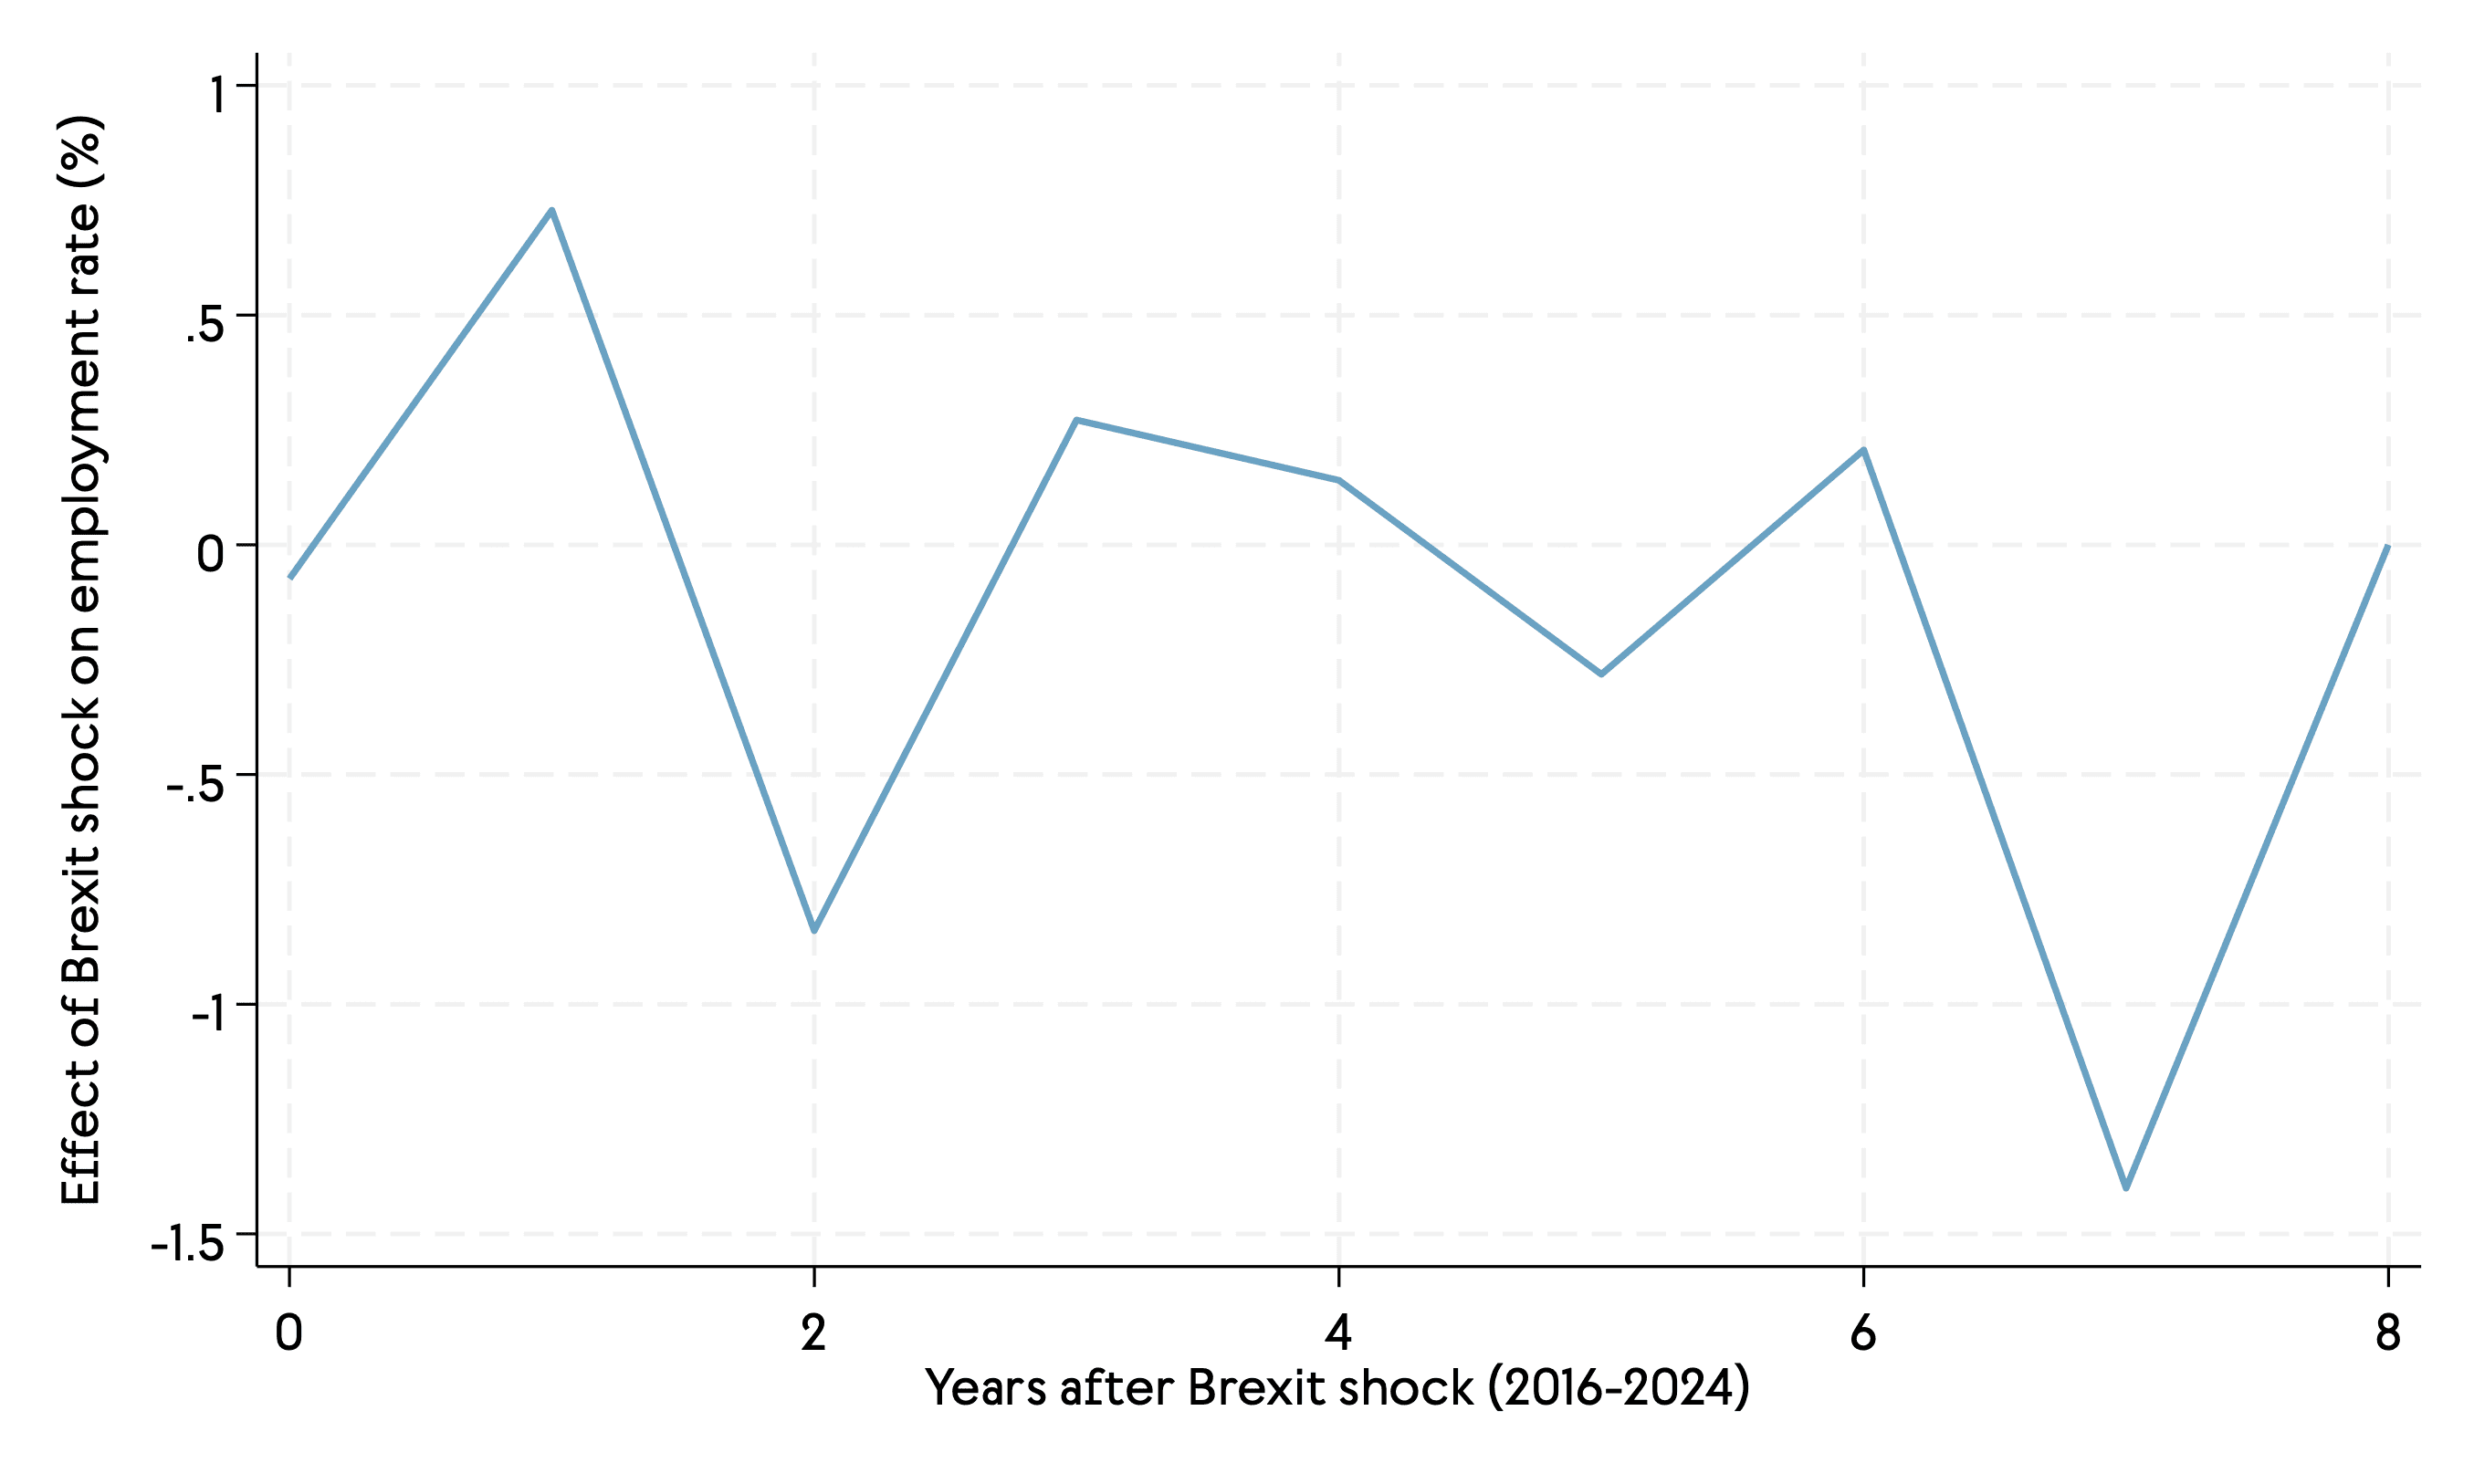
After controlling for all observable factors, we found that Brexit caused fluctuations to both employment and economic inactivity rates in the West of England (see Figures 2 and 3 respectively). The graphs on the left show the effect of the 2016 referendum – i.e. they show Brexit-related uncertainty affecting the labour market in the West of England since 2016. As shown, the employment rate decreased by 0.8% while the inactivity rate increased by 1% between 2016 and 2024 due to Brexit compared to the non-Brexit scenario, albeit this fluctuates between years. The analysis uses a weighted average over the full period and controls for various economic factors, such as GDP per capita, inflation rate, and average income.
The graphs on the right show the results from 2021 onwards, after Brexit was implemented. They emphasise Brexit’s detrimental effect on the labour market, showing a fall in employment rates of 1.2% and a 0.5% rise in the inactivity rate over the following three years due to Brexit.
Figure 2: Effect of Brexit on employment rate (left: 2016; right: 2021)
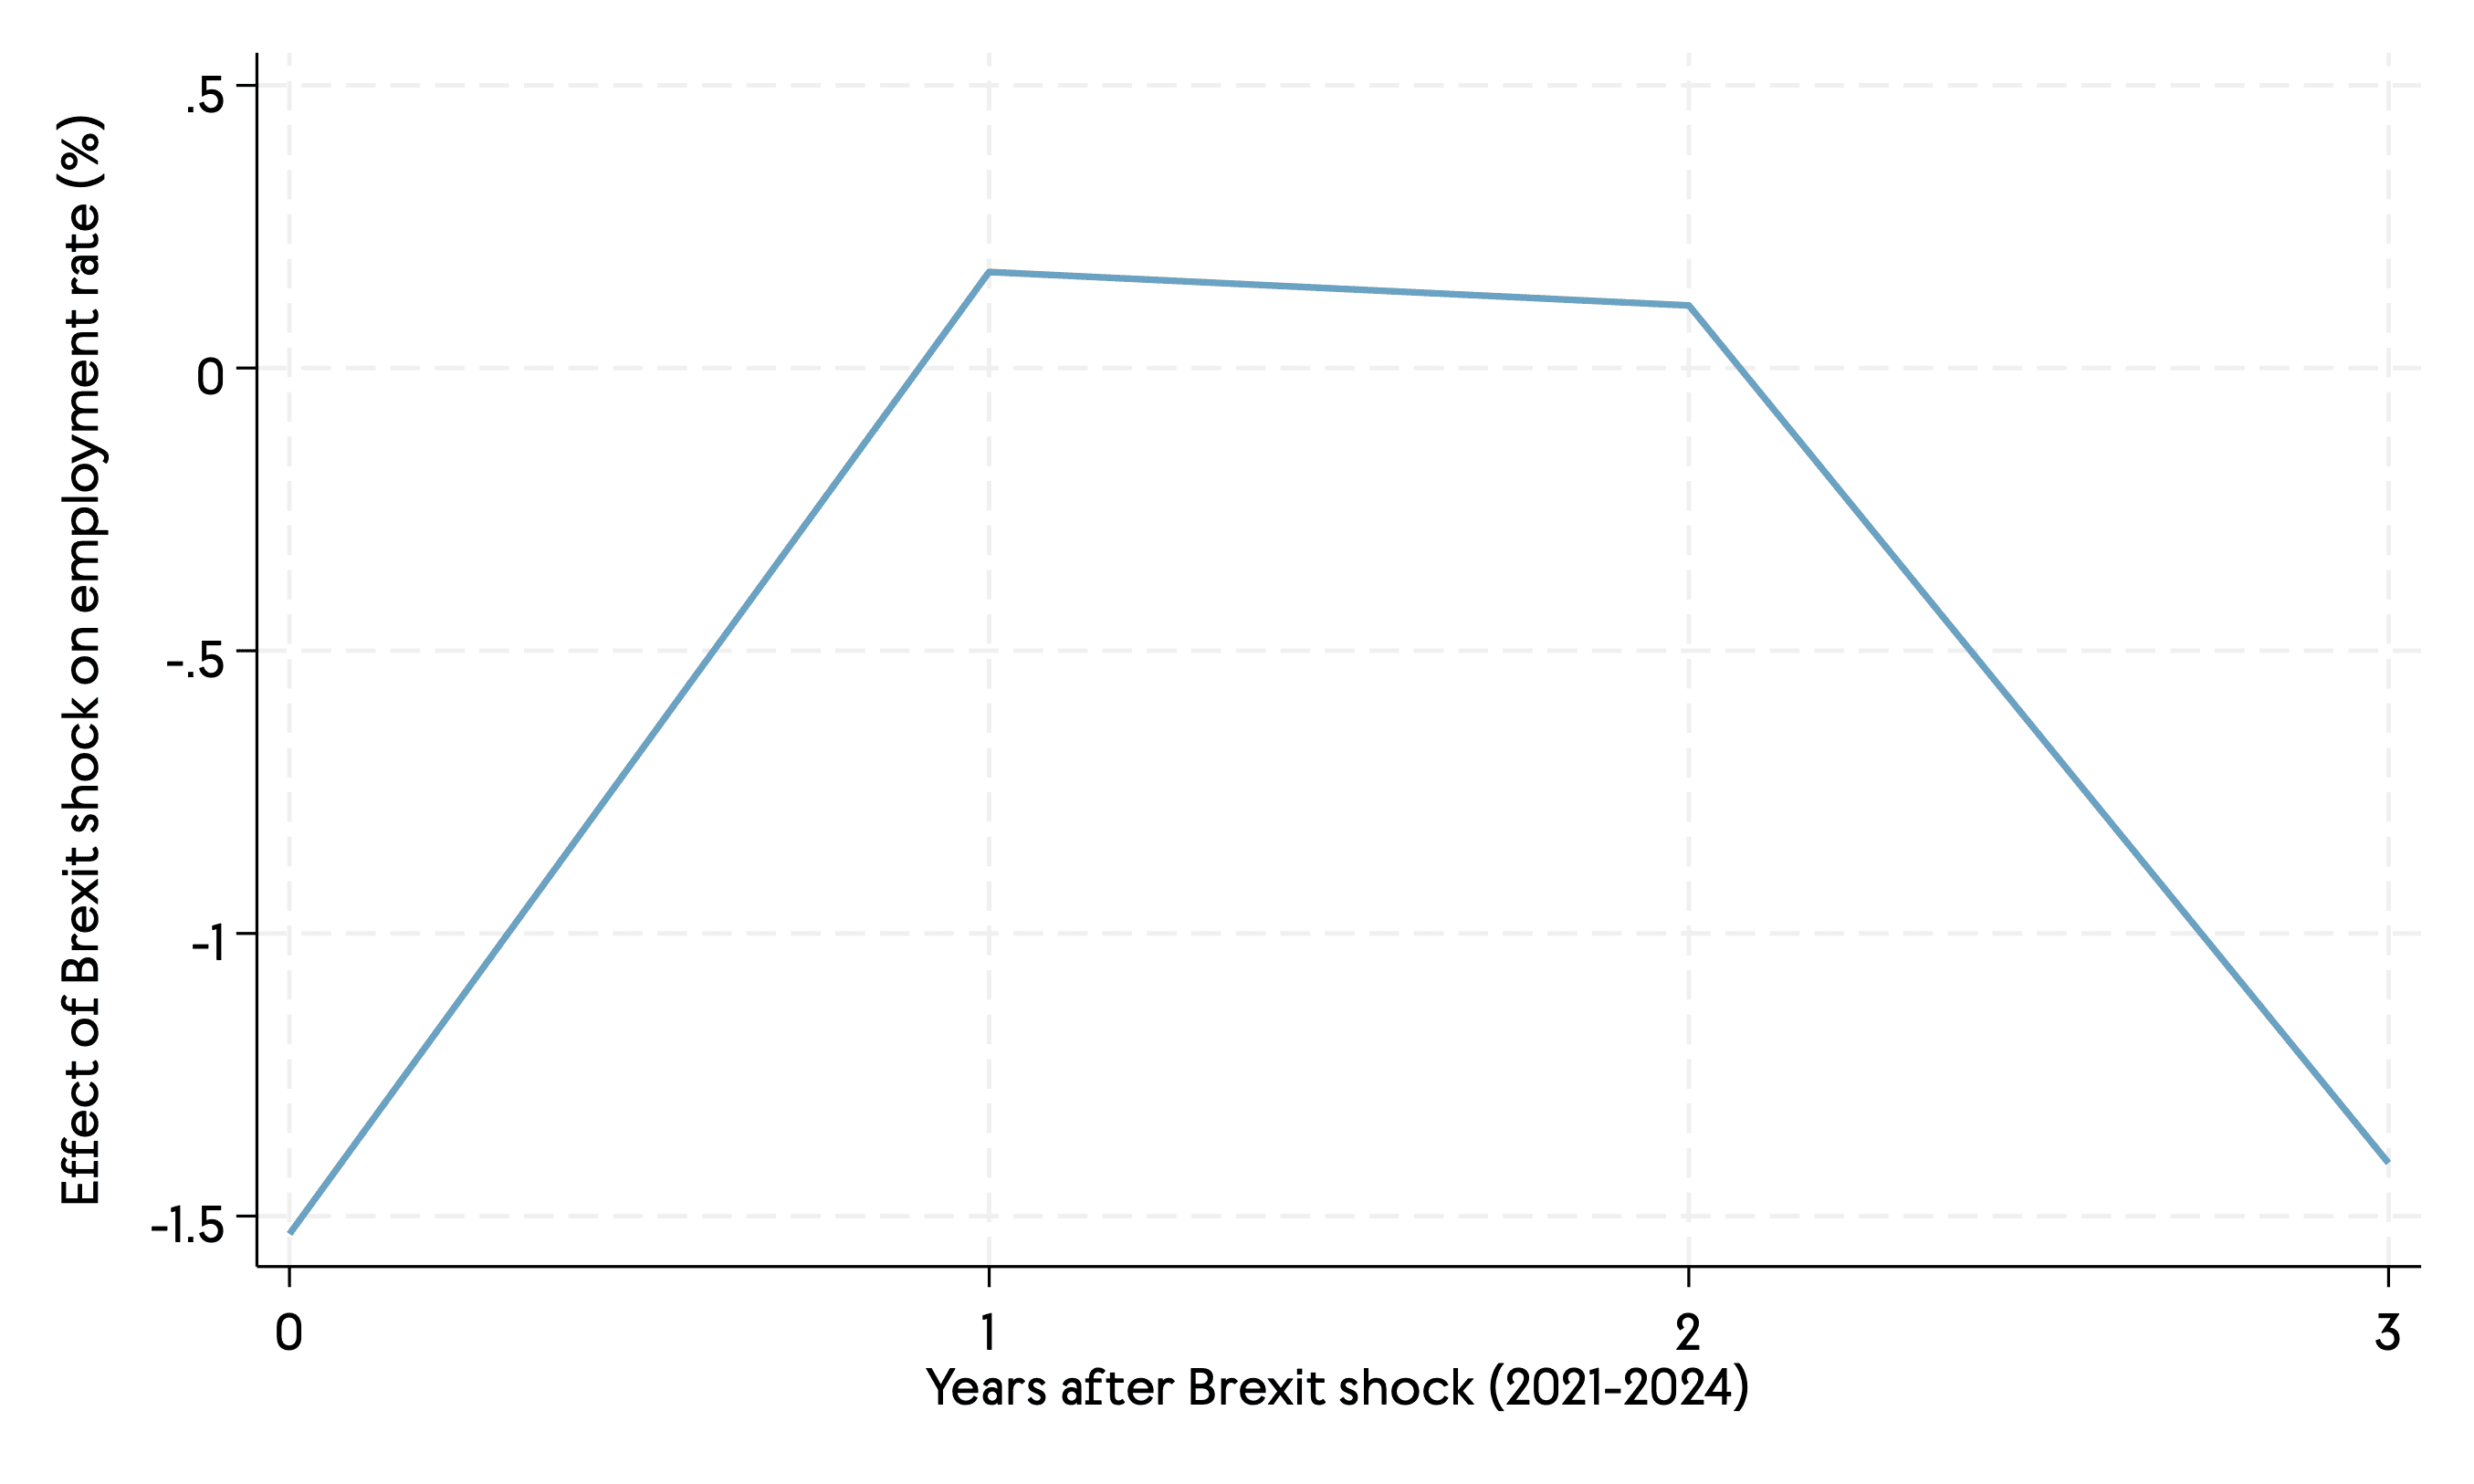
Source: Author’s calculation based on ONS, Annual Population Survey, and Labour Force Survey.
Figure 3: Effect of Brexit on inactivity rate (left: 2016; right: 2021)
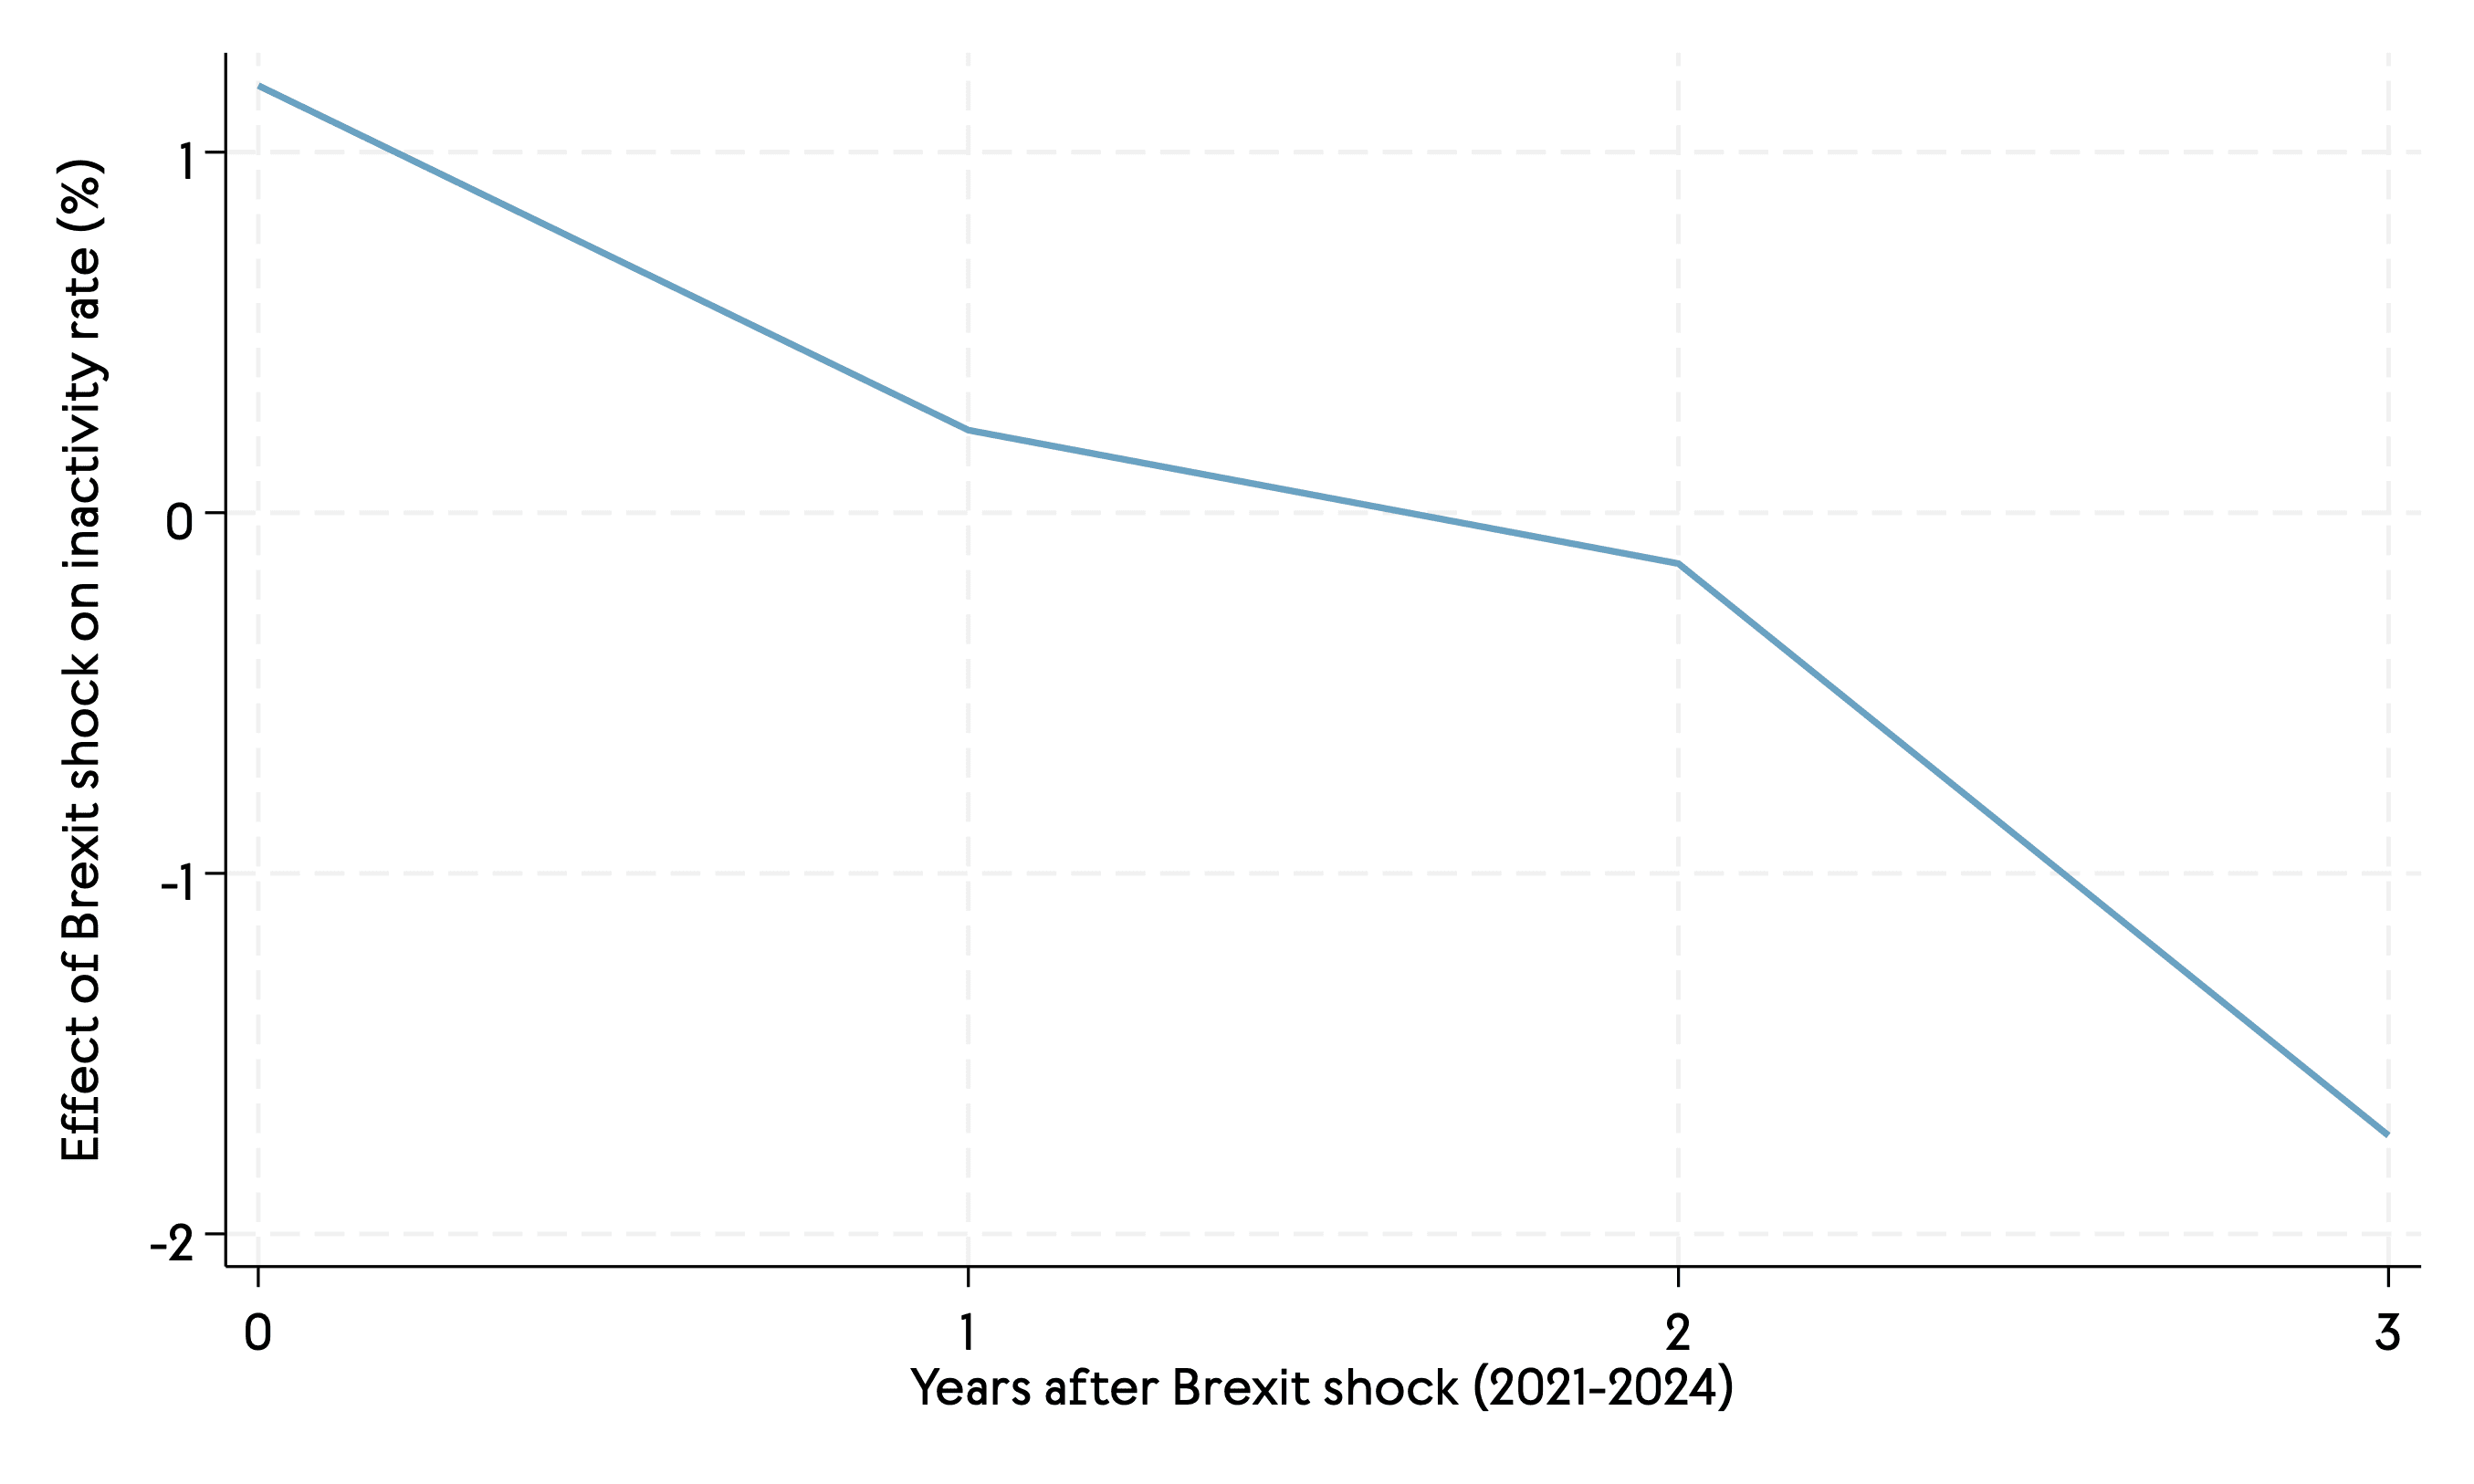
Source: Authors calculation based on ONS, Annual Population Survey, and Labour Force Survey.
The pandemic temporarily lowered employment rates in most sub-regions of the West of England (see Figure 4). Comparing the early years of the pandemic (e.g. March 2019 and March 2020) and March 2021 (after COVID restrictions had taken effect), we see that employment rates in all sub-regions except North Somerset dipped. Bristol, for example, fell to just above 75%.
Recovery followed in most sub-regions, with South Gloucestershire’s employment rate peaking at over 85% in 2024. Bristol’s rebound was comparably slower, reaching an employment rate of around 79% in 2024 before easing. North Somerset reported a strong recovery in 2023, but weaker performance in the later years. Bath and North East Somerset bucked the recovery trend – the employment rate fell from 2021 but regained some of its earlier strength in 2025.
England overall showed a milder dip and steadier trend which, in part, will be due to the larger sample size and because national figures tend to smooth out local fluctuations (downturns in some regions are offset by resilience in others). National data also reflect a broader sectoral mix, which might have contributed to making England’s employment rate estimates more stable over time compared with those of smaller areas, like the West of England local authorities.
Figure 4: Employment rate in the West of England since March 2019
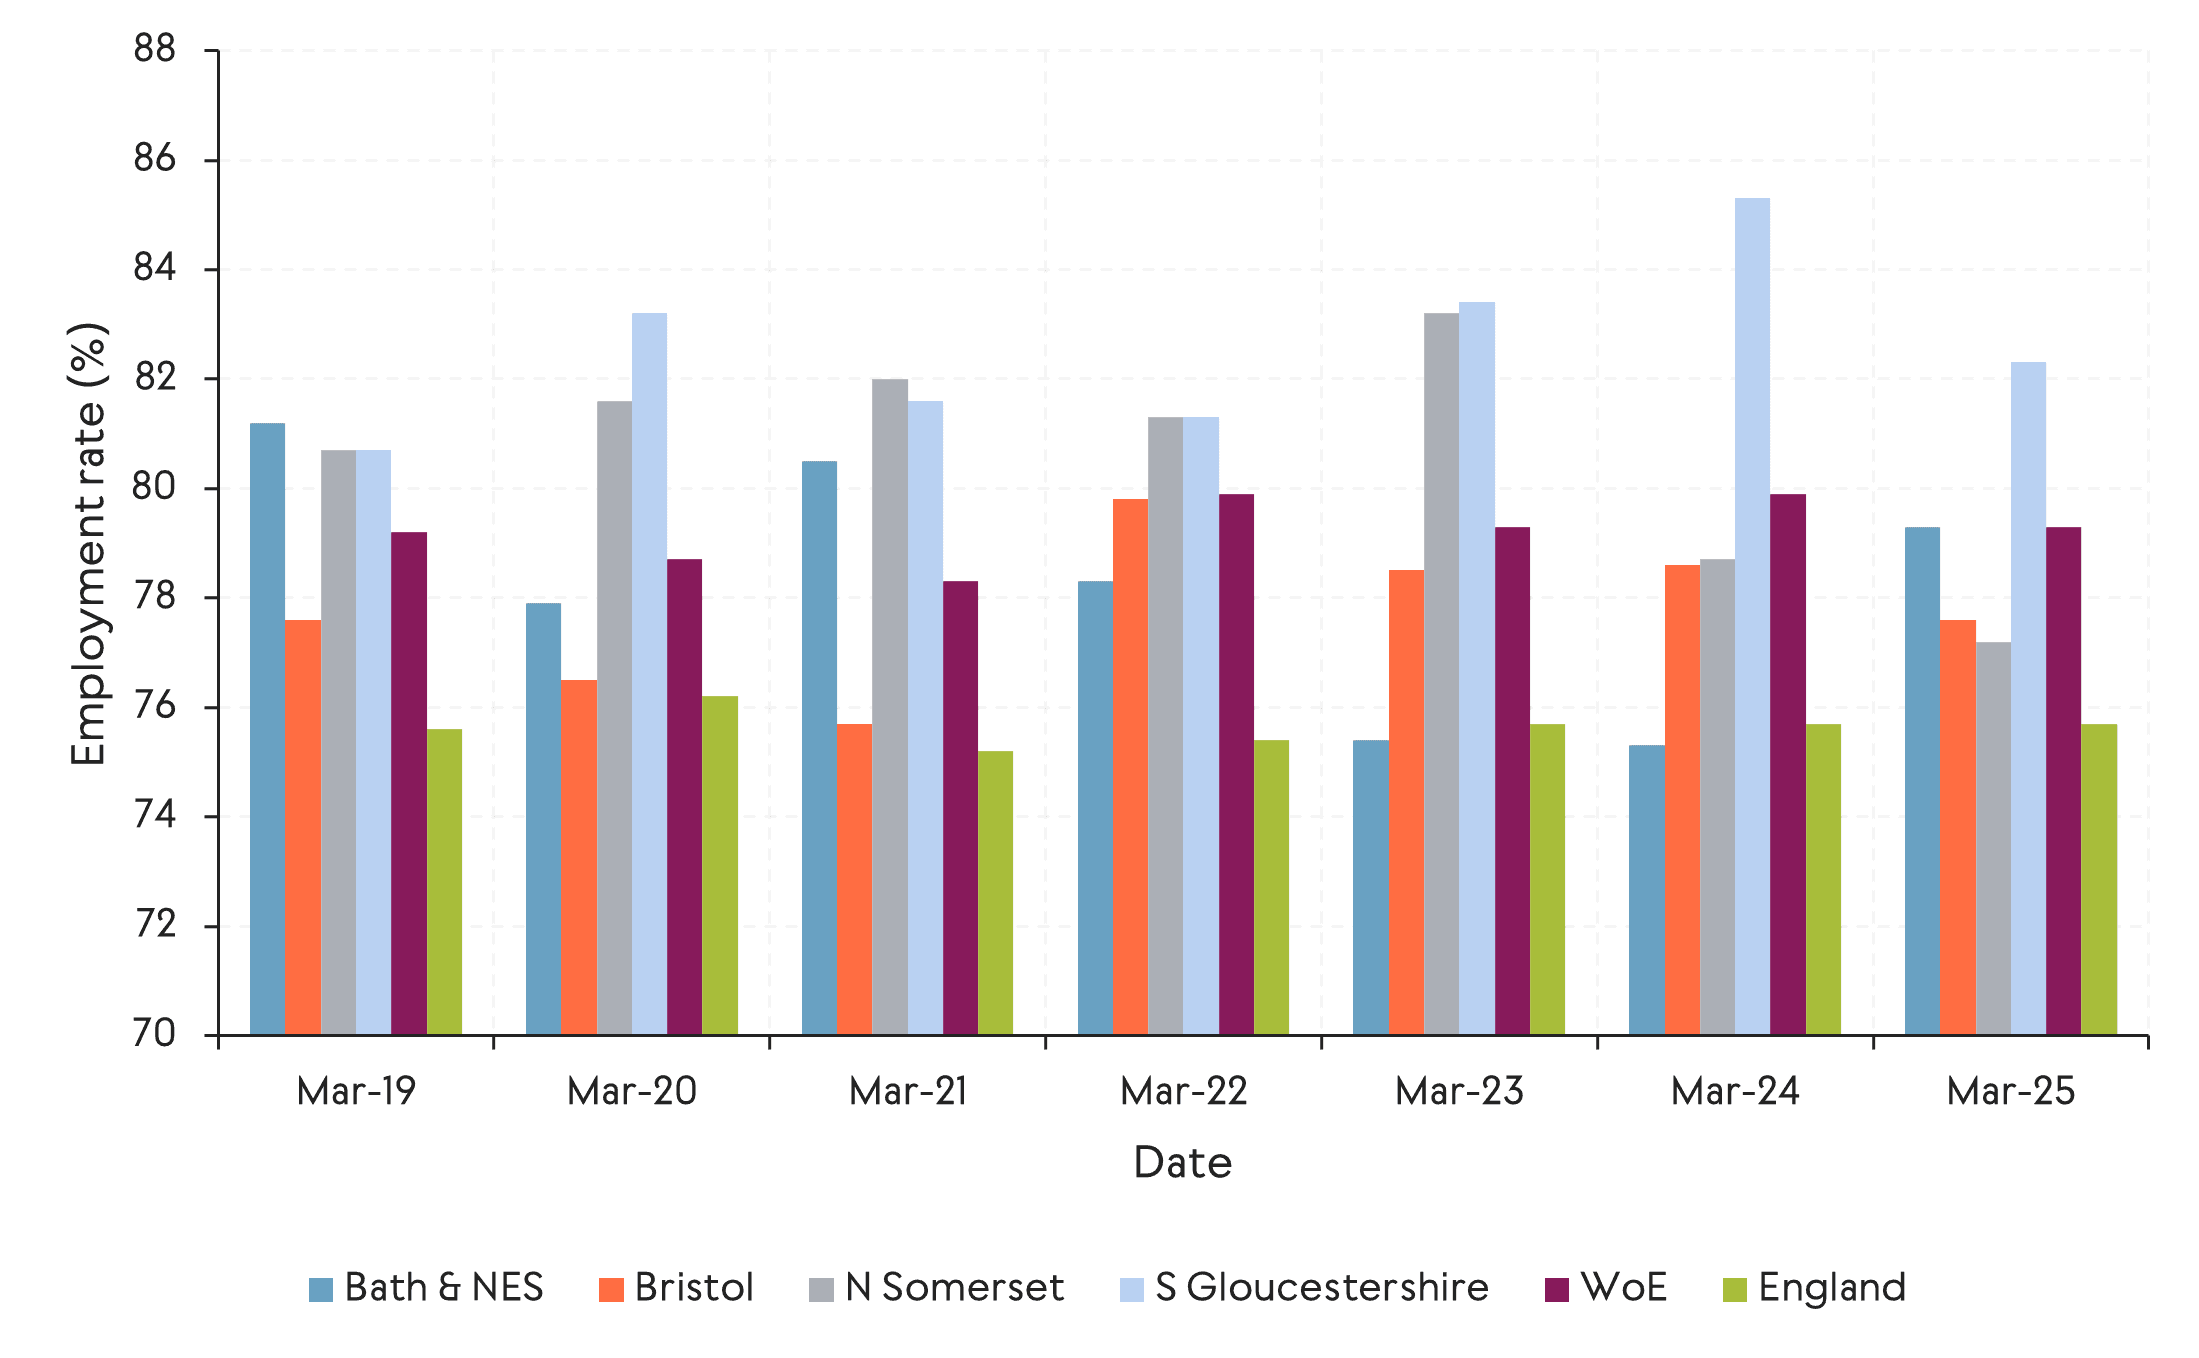
Source: ONS Annual Population Survey (03/2019-03/2025)
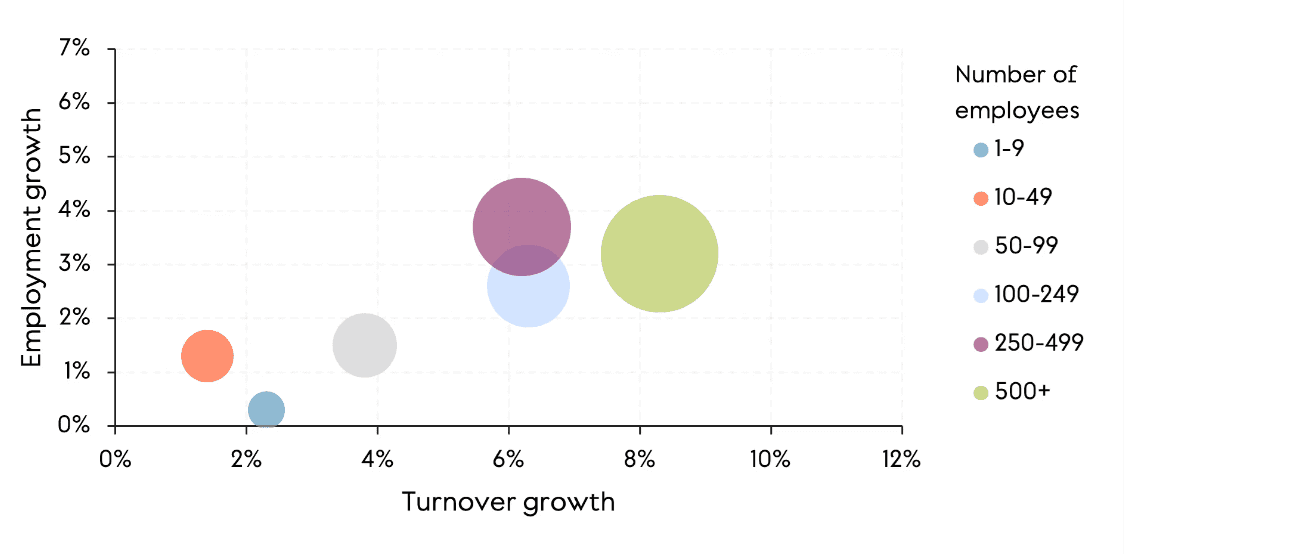
Before the COVID pandemic, firms employing 250-499 people experienced the highest rate of employment growth, while those employing over 500 people had the highest rate of turnover growth (see Figure 5). The data shows turnover growth and employment growth in the West of England by workforce size in two periods: 2015-19 (before the COVID pandemic), and 2020-24 (during and after the pandemic).
After the pandemic, firms with 250-499 employees or more than 500 employees continued to perform better in turnover and employment growth compared with firms with fewer employees. Turnover growth declined for firms hiring fewer than 100 employees after the pandemic.
In summary, the data reveal a greater polarisation of employment and turnover growth post-pandemic in larger companies (250+ employees) compared with smaller firms (fewer than 100 employees). This reveals the more severe impacts of the COVID pandemic on labour demand and business growth experienced by small- and medium-sized enterprises (SMEs) in the region.
Figure 5: Growth by employment size band in West of England
a) 2015-19
b) 2020-24
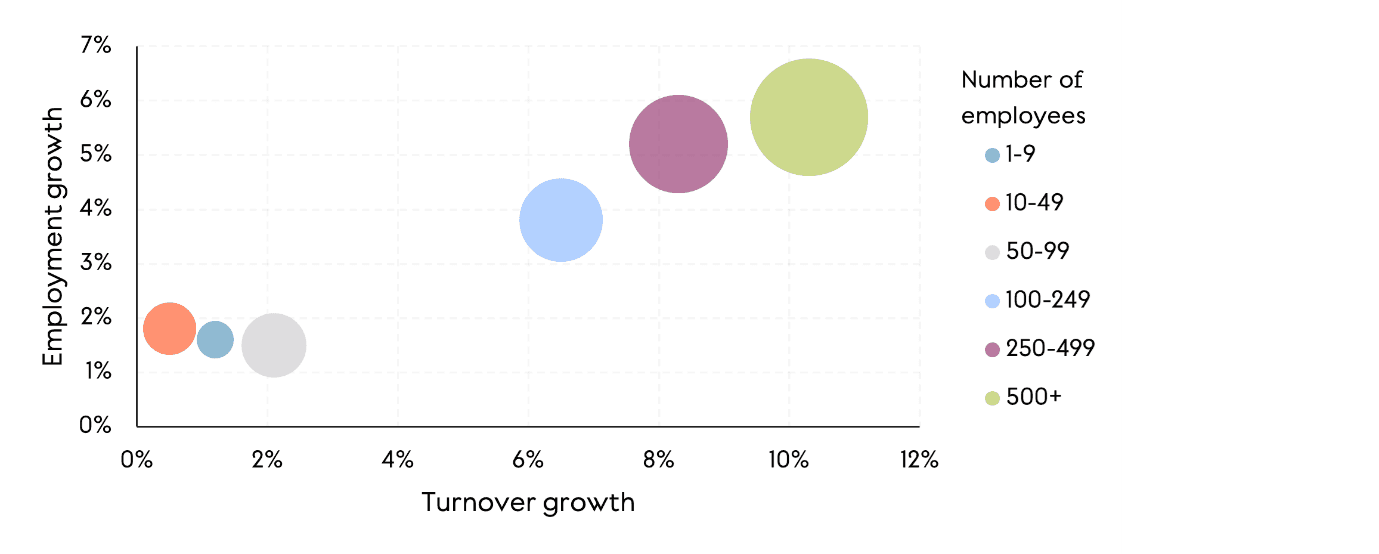
Source: FAME database; Business Register and Employment Survey (BRES) data from the ONS, 2015-24
Conclusion
The West of England labour market has demonstrated some resilience to the COVID-19 pandemic and Brexit. Despite this, employment in the region would have been higher in the absence of these major shocks.
Crucially, recovery has been uneven across local authorities in the region and smaller firms – those with fewer than 100 employees – have been more adversely affected than their larger counterparts (with 250+ employees).
References
Data sets:
ONS Annual Population Survey (03/2007-03/2024), Labour Force Survey (03/2007-03/2024).
ONS Annual Population Survey (03/2019-03/2025)
FAME database, Business Register and Employment Survey (BRES) data 2015-2024
Bibliography:
Dhingra, S., Ottaviano, G., Sampson, T. and Van Reenen, J., 2016. The impact of Brexit on foreign investment in the UK. Brexit, 24(2), pp.1-10.
House of Commons (2023) Post-pandemic economic growth: UK labour markets. [online] Available from: https://committees.parliament.uk/publications/39129/documents/192346/default/ (Accessed 02 April 2024)
Local Government Association (2022) Work Local: labour market analysis. [online] Available from: https://www.local.gov.uk/publications/work-local-labour-market-analysis (Accessed 28 March 2024)
National Institute of Economic and Social Research (NIESR) (2023) Stuttering Global Growth [online] Available from: https://www.niesr.ac.uk/publications/stuttering-global-growth?type=global-economic-outlook (Accessed 11 April 2024)
Portes, J., 2024. Unintended consequences? The changing composition of immigration to the United Kingdom after Brexit. National Institute Economic Review, 268, pp.63-78.


