economy
growth
sectors
productivity
Spaces and sectors driving productivity in the West of England
The West of England’s strong productivity is powered by concentrations of high-value sectors. Advanced manufacturing in South Gloucestershire drives regional performance, but diverse concentrations in other areas suggest how place-based assets and cross-sector links can enhance region-wide growth.
This policy insight provides an overview of productivity levels across the West of England’s constituent local authorities of Bath and North East Somerset, Bristol, North Somerset and South Gloucestershire. It contextualises these productivity levels by looking at the sectors located in these areas and discussing existing policy, infrastructure, and businesses, as well as business sentiment and breakdown of gross value added in specific sectors.
What does the evidence tell us?
The West of England has a diverse regional business base, with specialisation in different sectors divided across the local authority areas. These sector specialisms are indicative of economic performance and potential, mirroring productivity patterns in a way that warrants attention. Some of the issues discussed here are explored in greater detail in the Brunel Centre publication: ‘Closing the Productive Gap’.
Advanced manufacturing has clustered successfully in South Gloucestershire, generating productivity that contributes disproportionately to regional performance. Bristol specialises in professional and business services, which place the city’s productivity above some other neighbouring local authorities. But these benefits are comparatively limited, as high-value firms are more densely co-located with population-serving businesses that are less productive on average.
High-value, productivity-intensive sectors and everyday economy businesses both play important roles in sustainable and inclusive economic development. The Growth Strategy produced by the West of England Combined Authority (WECA) already identifies links between foundational and high-value sectors through regional ‘enablers’ such as skills, infrastructure and place-based assets. This suggests that these enablers can be more precisely targeted towards concentrations of workers, jobs and cultural commodities that align good work with quality of life.
To build on these strengths, government and industry should work to expand access and visibility of pathways between sectors and underlying skill support, such as up- and re-skilling, to enable mobility across the foundational and high-value economy. This would extend the competitive movement of workers between jobs and companies seen in high-value clusters, supporting cross-economy knowledge transfer, productivity spillovers and progression into higher-skilled roles and industries.
Which areas are productive?
Between 2008 and 2023, the West of England presented a higher annual average rate of growth by real gross value added (GVA) – a measure of the value of goods and services produced – than England as a whole. Understanding where this growth comes from is invaluable in identifying why the region has outperformed national averages, and how it has expanded its existing strengths and addressed weaknesses to cement its place as a regional and national engine for growth.
To further examine growth in the West of England, productivity levels are measured across the local authorities and against a UK benchmark (see Figure 1). To measure productivity, GVA per hour worked is used as it provides an accurate measure of productivity that prevents population change from influencing real productive output.
Productivity levels vary markedly across the West of England’s local authorities. South Gloucestershire is a clear outlier, recording output of £57.60 per hour, which is substantially above the UK average of £41.90. By contrast, the other three authorities sit below the national benchmark. Bristol records £36.60 per hour, slightly ahead of North Somerset (£35.90) and Bath and North East Somerset (£34.10), but still below the UK average. The West of England’s strong productivity performance is therefore driven by South Gloucestershire rather than reflecting uniformly high output across the region.
Figure 1: Productivity differences across the region
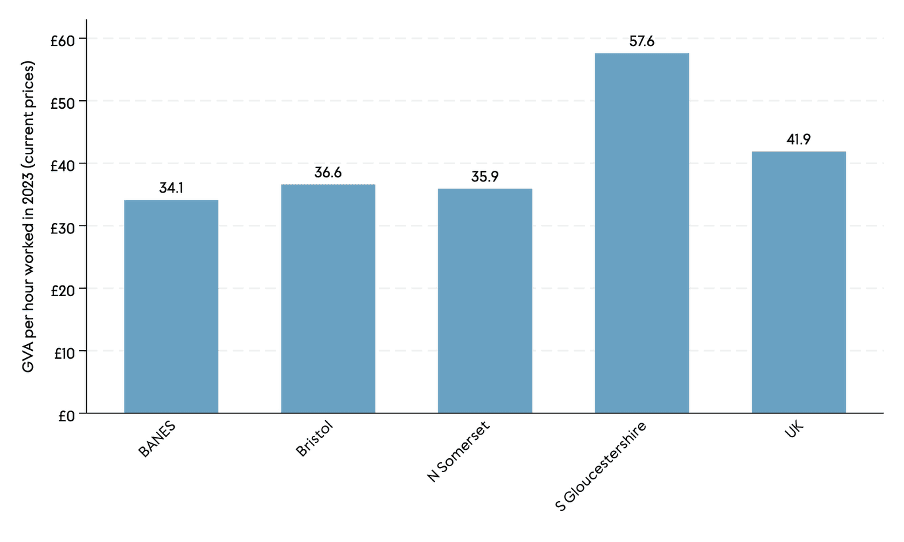
Source: Office for National Statistics, ONS (2025), subregional productivity: labour productivity indices by local authority district
Where does productivity come from?
Industry composition is often found to play a relatively minor role in explaining UK regional productivity differences (Martin et al., 2018; 2019), but the geographic productivity differences across the West of England indicate that the two are closely associated here.
South Gloucestershire’s markedly higher output per hour, for example, reflects the concentration of aerospace and advanced manufacturing activities based there. Although the region’s manufacturing sector produces a lower proportional output than the UK average, the specialisations in South Gloucestershire exemplify its place at the forefront of the region’s transition from mass production to knowledge- and technology-intensive businesses.
A dominant proportion of the West of England’s manufacturing output is generated through capital-intensive, high-value activities (see Table 1 showing sub-sectoral contributions to GVA). These activities exist in a distinctive ecosystem of prime contractors, suppliers and emerging firms that often collaborate through critical innovation infrastructure in South Gloucestershire. This includes the 100-hectare Filton Enterprise Area that is at the heart of Western Innovation Arc, the £32 million Global Technology Centre at Patchway backed by the Aerospace Technology Institute, and the NCC (GKN Aerospace, n.d.; Filton Enterprise Area, 2025).
This ecosystem is also home to the UK's largest aerospace cluster, worth over £2.7 billion (Invest Bristol and Bath, 2022). High productivity in South Gloucestershire is therefore built on components identified as critical to both the national Industrial Strategy and regional Growth Strategy’s Advanced Manufacturing sectors (Department for Business and Trade, DBT, 2025; WECA, 2025).
Further, the integration of the aerospace industry in the area demonstrates the 'co-location effect' identified nationally, where sectors identified in the Industrial Strategy (IS-8) cluster to share knowledge, infrastructure and skilled labour (Wang and Swinney, 2025). This highlights how the West of England's regionally significant manufacturing base is also a nationally strategic economic and innovation-driving asset.
Table 1: Manufacturing in the West of England, 2023
Sector | Share of regional GVA (%) | Activities |
Total manufacturing | 8.78 |
|
Manufacture of electrical products & machinery | 5.54 | Advanced engineering cluster: aerospace, electronics, precision machinery |
Manufacture of petroleum, chemicals & minerals | 0.84 | Materials, construction inputs, pharmaceutical products |
Manufacture of food, beverages, textiles & clothing | 0.74 | Food and drink processing; local supply chains |
Manufacture of basic & fabricated metal products | 0.61 | Metalworking and engineering components |
Manufacture of wood, paper & printing | 0.53 | Printing, packaging, and design-linked production |
Other manufacturing, repair & installation | 0.51 | Precision instruments, repair and installation services |
Source: ONS, regional gross value added (balanced) by industry (local authorities); Business Register and Employment Survey (BRES); UK Business Counts (Inter-Departmental Business Register, via NOMIS).
In contrast to South Gloucestershire, the economies of Bristol, Bath and North East Somerset, and North Somerset exhibit lower measured productivity than the UK average. Businesses in these areas are largely service- and population-oriented, which means that they have experienced greater volatility as a result of global shifts such as the 2007-09 financial crisis and the COVID-2019 pandemic (Whittard et al., 2025).
These sectors are nonetheless important to local economies. This was highlighted by a business support manager during a primary qualitative study of business sentiment conducted for this Brunel Centre economic audit:
Productivity is obviously important, but I think businesses who are feeding their families and putting food on the table and actually are living a good and happy life is just as important... don't forget the 97% of businesses that just are running a shop, they are important in the supply chain. They're buying goods, they are employing people, they're spending locally. That local spend is really important.
This sentiment is reflected in WECA’s Growth Strategy, which aims to develop high-value sectors aligned with the government’s strategy while also placing the everyday economy as a priority for local growth (WECA, 2025).
Key sectoral opportunities for growth can be identified within these service-dominated economies, despite the lower-than-average productivity of the broader local authority areas. In Bristol, for example, high-value technical activities that tend to record higher output per worker are well represented. In addition, over 30,000 people are employed in financial and related professional services in the city, placing it among the UK's principal financial and professional centres outside London (TheCityUK, 2024).
Business composition remains an important determinant of productivity differences between local authorities in the West of England, as shown by strengths in high-value services and Bristol’s marginal outperformance of its neighbours. The impact of these sectors on the regional economy as a whole is investigated further in the policy insight 'Regional resilience: A story of faster growth in the West of England'.
Tracing the West of England’s productivity over time
Productivity levels between local authorities in the WECA region have increasingly diverged between 2004 and 2023 (see Figure 2).
South Gloucestershire’s productivity levels have followed a clear and sustained upward trend over this period, progressively separating it from the rest of the region. It was initially only modestly ahead, but over time has established a substantial and widening lead, indicating that most of the region’s productivity growth is concentrated in this area.
Productivity in Bristol has remained relatively stable. After some gains in the late 2000s, productivity has broadly plateaued and fluctuated within a narrow range for most of the subsequent decade. Although Bristol consistently performs above Bath and North East Somerset and often North Somerset, its relative position changes little over time. There is therefore limited evidence of compounding or accelerating gains. Instead, the city maintains a stable but not expanding advantage.
Bath and North East Somerset displays the most stable trajectory, with productivity remaining largely flat between 2004 and 2023, aside from short-term cyclical movements, including a pronounced dip around 2020 (likely a result of the COVID-19 pandemic).
North Somerset shows greater volatility, with weaker performance in the late 2000s and early 2010s, followed by gradual recovery and some recent improvement that has led to a narrowing of the gap with Bristol.
Figure 2: Evolution of productivity across WECA local authorities, 2004-23
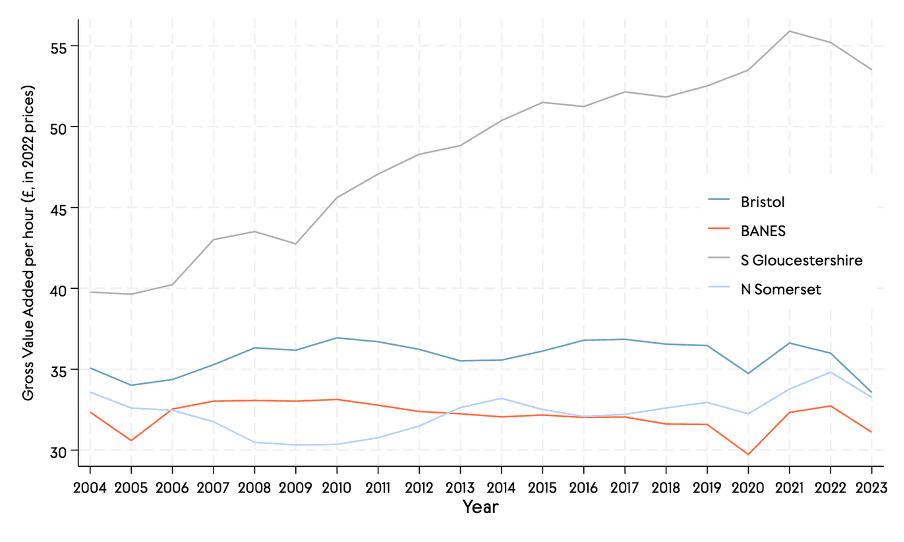
Source: ONS (2025), subregional productivity: labour productivity indices by local authority district
Note: Narrow reading of Figure 2 should be approached with caution. Calculations are based on chained measures over time, so direct comparisons between authorities in a single year can be inaccurate. The value of Figure 2 lies instead in patterns over the long term discussed here.
The trends in regional productivity suggest that the effects of where different sectors are located (the sectoral composition) result in persistent geographic differences in the West of England, rather than broad dynamic growth across the region as a whole.
Productivity gains are uneven and spatially concentrated, with sustained improvements evident mainly in South Gloucestershire, while the other authorities exhibit relative stability. This uneven pattern reinforces the importance of local industrial structure in shaping productivity outcomes across the region.
Conclusion
The concentrations of productivity around high-value business footprints, particularly advanced manufacturing and professional services, reaffirm the benefits of agglomeration. Dense pockets of relevant businesses drive growth through shared skills, integrated supply chains, collaborative infrastructure and a collective external voice. But the benefits of these clusters are often limited at a local authority level where high-value firms are co-located with population-serving businesses that are less productive on average.
To maximise the contribution of both areas of the economy, the links between foundational and high-value sectors in WECA’s Growth Strategy can be deepened. In particular, government and industry should strategically target up- and re-skilling programmes that enable pathways for workers between the foundational and high-value economy. This would extend cluster benefits more widely through cross-economy knowledge transfer, productivity spillovers and progression into higher-skilled roles and industries.
References
Department for Business and Trade [DBT] (2025) The UK’s Modern Industrial Strategy. London: HM Government. Available at: https://www.gov.uk/government/publications/industrial-strategy
Filton Enterprise Area (2025) About Filton Enterprise Area. Bristol: South Gloucestershire Council. Available at: https://beta.southglos.gov.uk/enterprise-filton/
GKN Aerospace (n.d.) UK Operations. Available at: https://www.gknaerospace.com/en/about-gkn-aerospace/locations/uk/
Invest Bristol and Bath (2022) Aerospace and Advanced Engineering. Bristol: West of England Combined Authority. Available at: https://www.bristolandbath.co.uk/key-sectors/aerospace-advanced-engineering/
Martin, R., Sunley, P., Gardiner, B., Evenhuis, E. and Tyler, P. (2018) The city dimension of the productivity growth puzzle: the relative role of structural change and within-sector slowdown. Journal of Economic Geography, 18(3), pp. 539–570. Available at: https://eprints.soton.ac.uk/420172/1/City_Dimension_of_the_Productivity_Puzzle_Revised_November_21_2017_copy.pdf
Martin, R., Sunley, P., Gardiner, B., Evenhuis, E. and Tyler, P. (2019) The economic performance of Britain's cities: patterns, processes and policy implications. Centre for Cities. Available at: https://www.centreforcities.org/wp-content/uploads/2019/02/The-Evolving-Economic-Performance-of-Britain%E2%80%99s-Cities-Patterns-Processes-and-Policy-Implications.pdf
TheCityUK (2024) Enabling Growth Across the UK 2024: UK-based Financial and Related Professional Services. Available at: https://www.thecityuk.com/media/sapbwnqv/enabling-growth-across-the-uk-2024-uk-based-financial-and-related-professional-services.pdf
Wang, Y. and Swinney, P. (2025) Eight Sectors, One Story: The Geography of the Industrial Strategy. Centre for Cities. Available at: https://www.centreforcities.org/publication/eight-sectors-one-story-the-geography-of-the-industrial-strategy/
West of England Combined Authority [WECA] (2025) West of England Growth Strategy. Available at: https://www.westofengland-ca.gov.uk/wp-content/uploads/2025/09/Growth-Strategy-Web.pdf
Whittard, D., Phan, V. & Gezici, A. (2025) Closing the Productivity Gap. The Brunel Centre. Available at: https://www.bath.ac.uk/publications/closing-the-productivity-gap/


