housing
infrastructure
wages
How housing affordability is impacting regional growth in the West of England
Housing affordability in the West of England is increasingly constraining the region’s ability to grow inclusively and sustainably. Despite distinct local housing markets, a shared trend of rising unaffordability is affecting every local authority across the region.
This policy insight looks at housing and rental affordability across the West of England. It uses data from Office for National Statistics (ONS) to examine trends in house prices. It also looks at housing tenure using census data from 2021, comparing both within the region and across other comparable combined authorities.
Housing is a foundation of economic and social life, shaping where people live, work, form families and access opportunity. For individuals, access to stable, affordable housing influences nearly every outcome of interest, from health and education to employment and social mobility. Housing markets also determine how easily people and firms can come together, making them central to the functioning of local economies. Housing affordability, in particular, has become a central issue in the dynamics of economic activity and politics both nationally and internationally.
As in most advanced economies, there has been a dramatic increase in house prices and rent across the UK over the last 40 years, largely driven by insufficient housing supply and financialisation of the housing market. Much like other in regions across the UK, housing affordability is a well-known issue for the West of England economy.
How do house prices stack up within the West of England?
House prices in all four local authorities in the West of England are above the average of the wider South West and England as a whole (see Table 1). House price affordability ratios are also higher than the national average across the board but compare somewhat better with the South West average, due to higher median earnings. On this measure, both North Somerset and South Gloucestershire have marginally lower ratios than the other local authorities.
Table 1: Housing affordability in the West of England, house prices and rents
Median house price, 2024 | Mean rent, Oct 2025 | House price affordability[1], 2024 | Rent affordability[2], 2023/2024 | |
England | £289,995 | £1416 | 7.71 | 36.3% |
South West | £302,000 | £1072 | 8.36 | 31.4% |
Bath and North East Somerset (BANES) | £390,000 | £1770 | 9.70 | 42.7% |
Bristol | £340,000 | £1824 | 8.72 | 44.6% |
North Somerset | £315,000 | £1182 | 8.20 | 30.0% |
South Gloucestershire | £326,250 | £1424 | 8.31 | 31.3% |
Source: ONS - House Price Statistics for Small Areas (HPSSA), Annual Survey of Hours and Earnings (ASHE), Price Index of Private Rents (PIPR)
A focus on changes over time shows that comparatively high house prices are a relatively recent phenomenon in much of the West of England. While prices have always been elevated in Bath and North East Somerset (BANES), the other three local authorities followed a similar pattern to the England average until 2015 (see Figure 1). House prices in Bristol and South Gloucestershire then started to outpace the England average, while the premium in North Somerset is an even more recent development with a big spike during the COVID-19 pandemic, which has since levelled off.
Figure 1: Evolution of house price affordability ratios at the median in WECA local authorities 2001-24
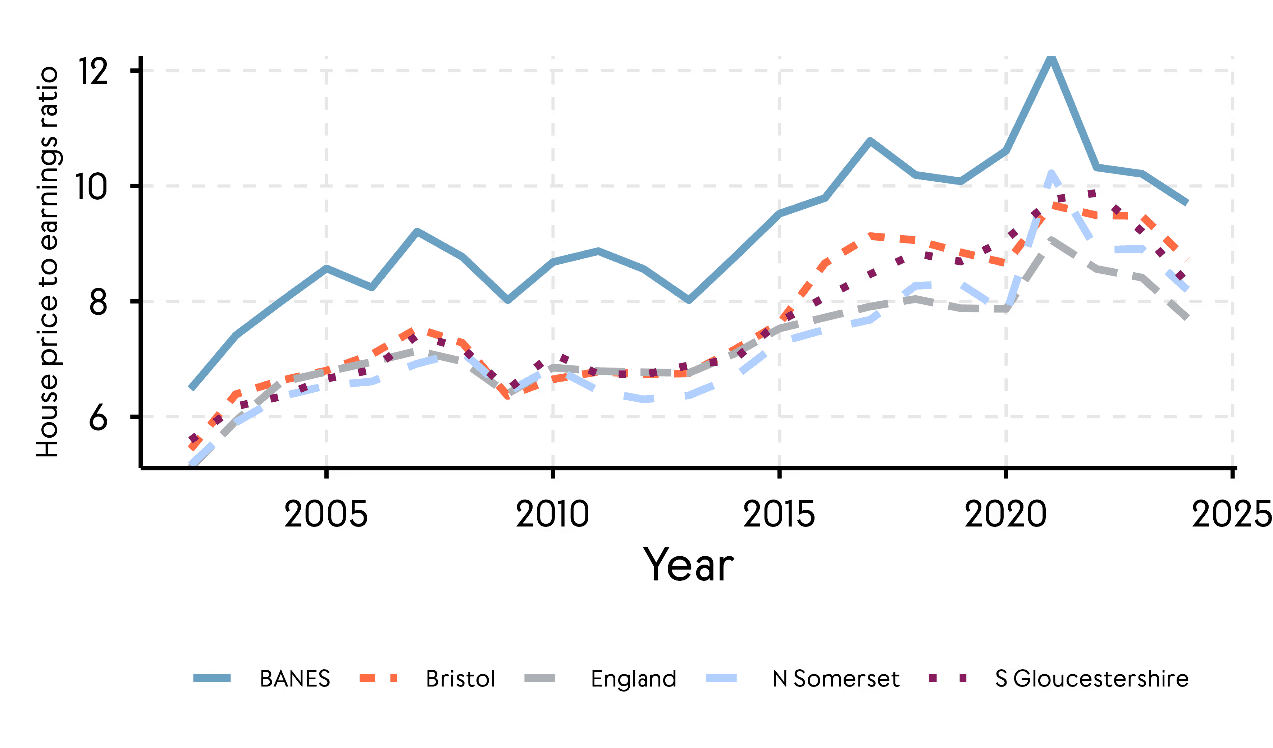
Source: ONS - House Price Statistics for Small Areas (HPSSA), Annual Survey of Hours and Earnings (ASHE)
The affordability picture is slightly different for those on a lower income in the West of England (here illustrated through the ratio of house prices and earnings at the lower quartile/25th percentile). For these individuals, houses have always been less affordable compared with the English average. What’s more, the rise in house prices from 2015 merely increased this gap. Across both measures and time, it is evident that house price affordability is a matter of significant concern in BANES.
Figure 2: Evolution of house price affordability ratios at the 25th percentile in WECA local authorities 2001-24
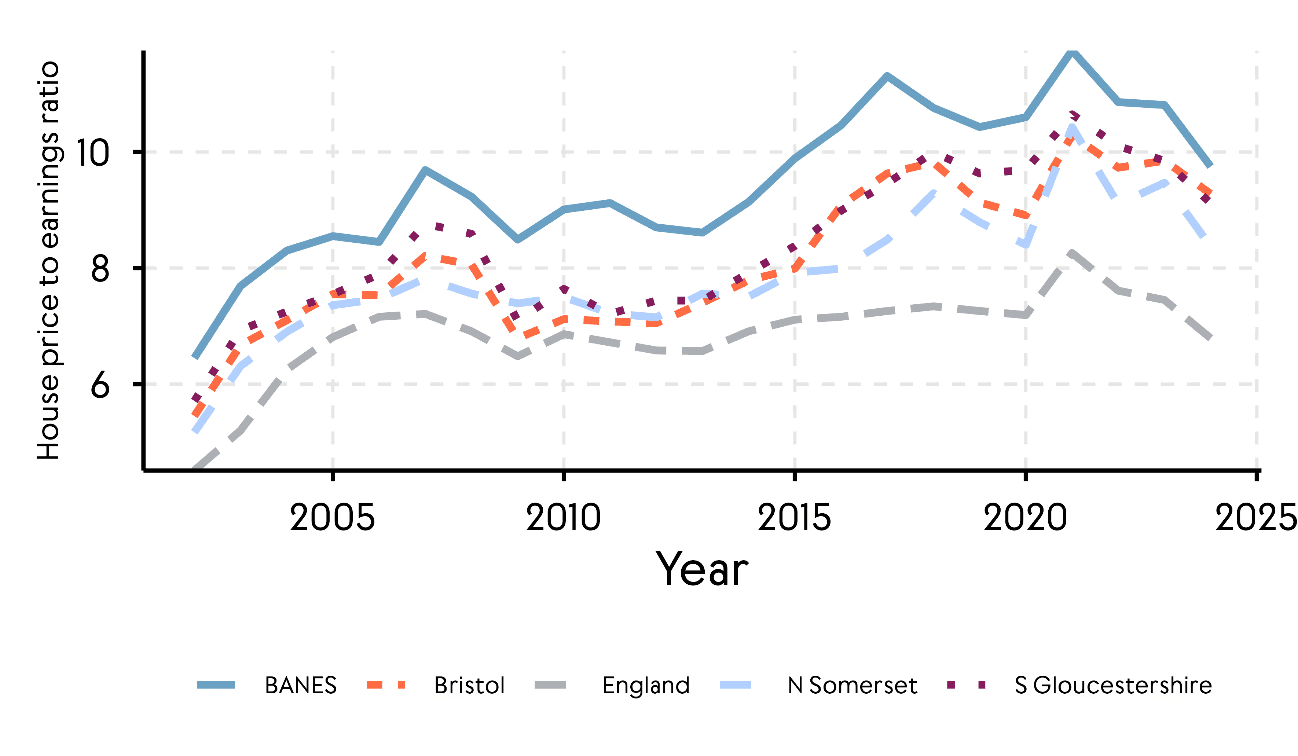
Source: ONS - House Price Statistics for Small Areas (HPSSA), Annual Survey of Hours and Earnings (ASHE)
How does the rental market compare?
When it comes to rental costs, the picture is slightly different (see Table 1). North Somerset has much lower average rents than the English average. Meanwhile, rents in South Gloucestershire are roughly the same as the average for England in absolute terms, but local median earnings result in a more affordable market. On the other hand, average rents are highest in Bristol and the ‘premium’ relative to the national average is much higher than for house prices. BANES still have high rents relative to the English average, but the ‘premium’ is lower than for house prices.
Between 2015 and 2023, all West of England local authorities saw disproportionately high increases in average rent prices relative to the England average, with this being particularly noticeable in Bristol and South Gloucestershire (see Figure 3). The last two years have seen some easing of the pressures in Bristol, but less so in the other three local authorities, which have broadly followed the national trend.
Figure 3: Changes in average rents across WECA local authorities indexed to January 2023
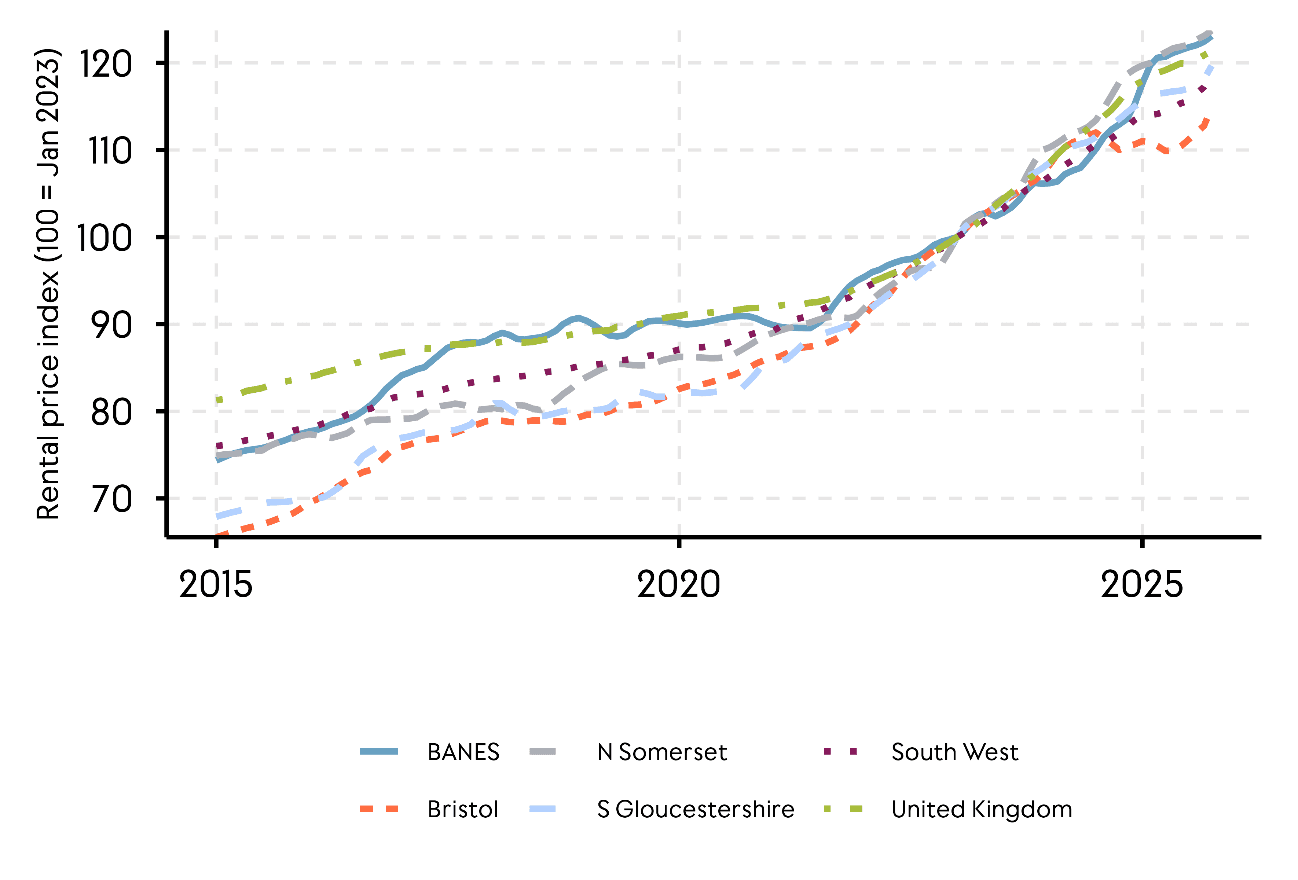
Source: ONS - The Price Index of Private Rents
Note: Average rents in January 2023 at 100
If we rank local authorities across England in terms of raw average rent prices in October 2025, Bristol has the 27th highest average rents in the country and BANES 32nd highest (out of 294 local authorities listed). This makes rent in these two areas higher than in several London boroughs. Indeed, Bristol is the fifth highest local authority outside of London in terms of rental costs[3].
While Bristol and BANES rank very highly on headline measures of average private rent, a comparison of similarly sized properties tells a slightly more nuanced story. Headline average rents in Bristol and BANES are measured as 1.29 times (x) and 1.25x the England average respectively, but one-bedroom properties are only 1.02x and 0.98x the England average. Three-bedroom properties in Bristol and BANES are 1.18x and 1.10x the England average respectively[4].
Bristol and BANES are the 45th and 49th most expensive local authorities respectively, when it comes to the average rent of one-bedroom properties and 57th and 54th when it comes to three-bedroom properties[5].
Overall, this suggests that Bristol’s high rental premium is not being solely driven by uniformly higher prices across the market but, in part, by how rents are aggregated in the ONS index-based measure of average rents, which does not account for the number of bedrooms. More specifically, compared with other urban rental markets, particularly in the South East, Bristol and BANES have a higher proportion of larger properties available to rent, driving up the average rent price.
This is not to say that rental prices are not high in Bristol and Bath but that the data suggest they are broadly similar to other urban centres with relatively close proximity to London.
How people live in their homes
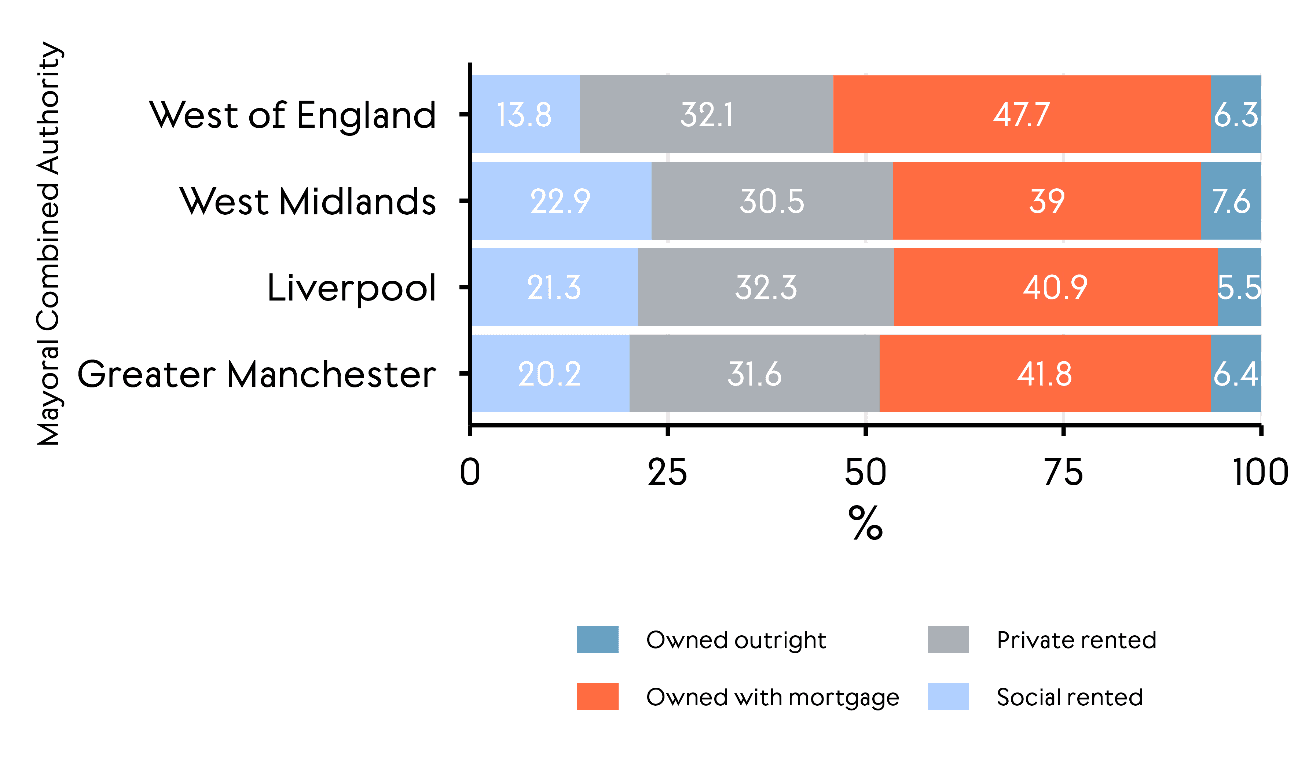
When it comes to housing tenure, WECA has high home ownership rates despite high house prices. Across the region, homeownership is higher than in the comparative Mayoral Combined Authorities (MCAs) in the West Midlands (WMCA), Greater Manchester (MCR) and Liverpool (LCR), as shown in Figure 3.
Yet, this is not evenly spread across the region. Homeownership is highest in South Gloucestershire and North Somerset, relatively high in BANES but considerably lower in Bristol, where there are particularly high rates of private renting (see Figure 5). It is worth noting that the data here are from 2021, so they do not account for recent changes in house or rent affordability, previously discussed in this article.
Figure 4: Housing tenure in the West of England relative to three other comparable MCAs
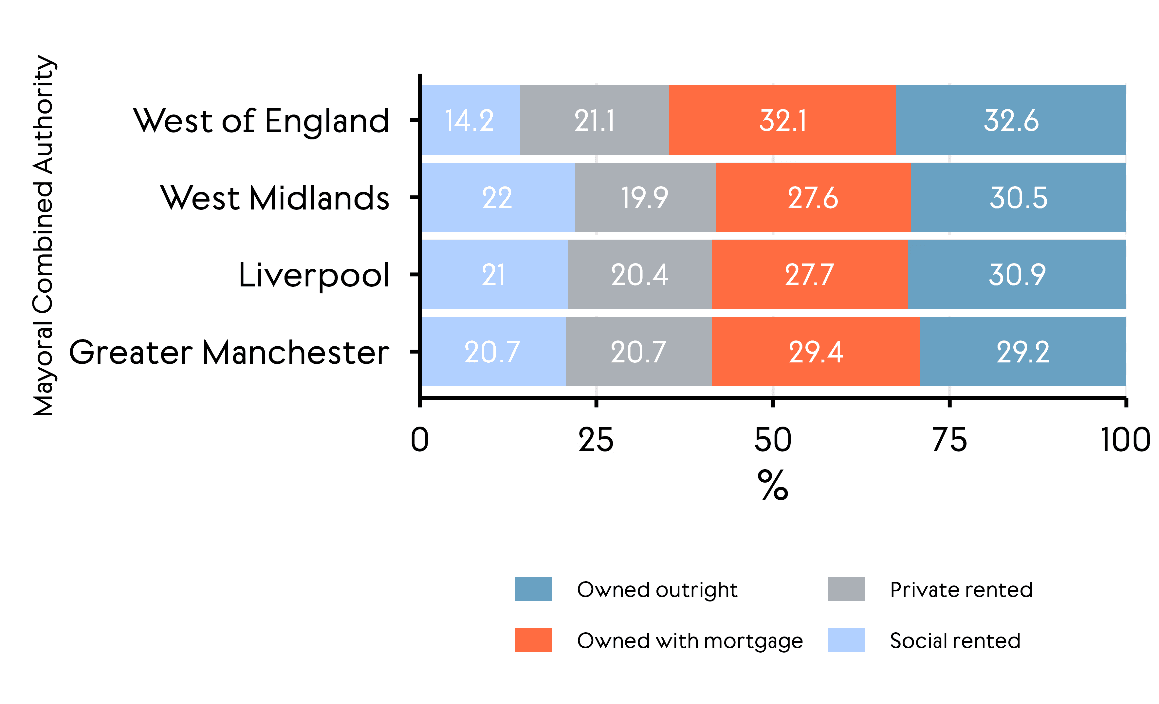
Source: Census, 2021
Figure 5: Housing tenure in West of England local authorities
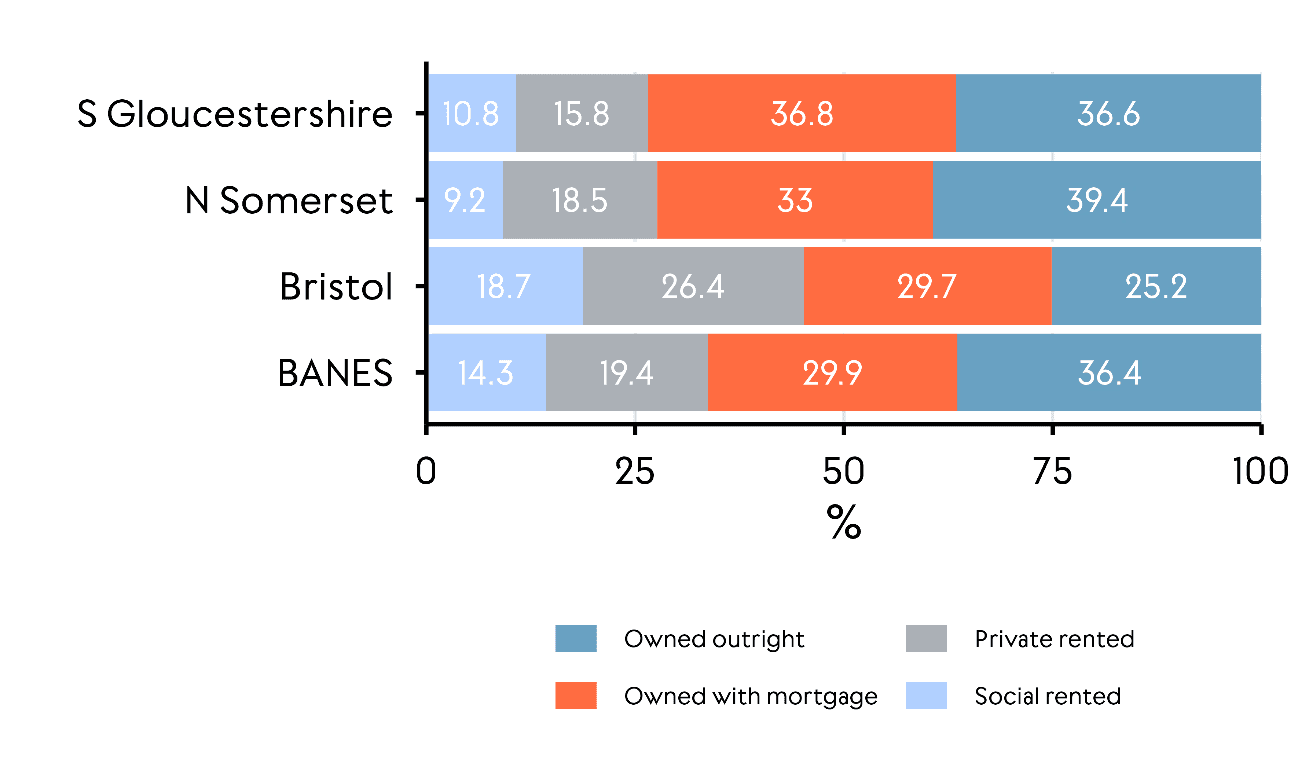
Source: Census, 2021
While housing in BANES is particularly unaffordable, ownership rates have remained relatively high across the West of England. Contrary to expectations, this is not solely driven by demographics. Restricting the analysis to 25-49-year-olds shows that homeownership rates are still higher in the West of England than the other three MCAs and rates in BANES are also high relative to the other West of England local authorities (see Figures 6 and 7). However, even if prices are not prohibitive for existing residents, high prices relative to earnings are likely to limit dynamism in the local economy and drive unfairness for those unable to rely on alternative sources of savings or wealth.
Figure 6: Housing tenure in WECA relative to three other comparable MCAs for 25-49-year-olds as household reference person
Source: Census, 2021
Figure 7: Housing tenure in WECA local authorities for 25-49-year-olds as household reference person
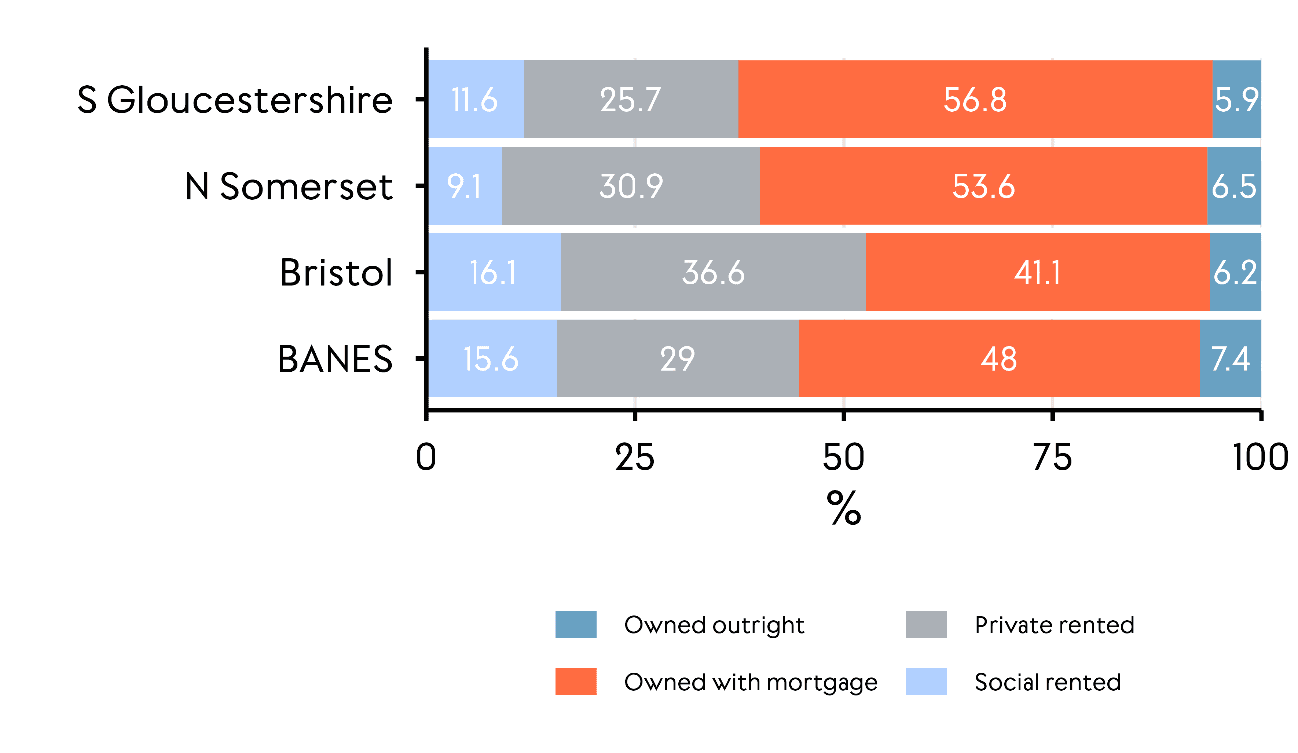
Source: Census 2021
Conclusion
Much like the rest of the UK, housing affordability in both the rental and ownership markets is a key challenge for the West of England. It is one that has the potential to limit local economic growth, primarily through raising hiring costs for firms and/or deterring in-migration to high-productivity areas. In addition, housing affordability is also likely to have an impact on inclusive approaches to growth, as lower- and middle-income occupations will be those most affected by higher housing costs.
To help address fundamental challenges related to housing affordability, the government has a key role to play in ensuring that the correct incentives are in place to build, finance and occupy housing. This will need to be supported by a regional spatial development strategy that sets out approaches to land-use rules, planning approvals and housing delivery strategies. Such a strategy must also address how housing is considered alongside the region's other economic ambitions.
Footnotes
[1] The ratio of median house prices to median residence-based earnings
[2] The ratio of mean private rent prices to median gross monthly income of privately-renting households expressed as a percentage
[3] After St Albans, Elmbridge, Oxford and Brighton and Hove, all of which are effectively in commuting distance of London.
[4] To compare with three other urban local authorities, Bristol overall rents are estimated at 1.38x those of Manchester, 1.61x York and 0.995x Brighton but the ratios are noticeably less for one bedroom (1.22x, 1.43x and 0.98x), two bedroom (1.25x, 1.46x and 0.97x), three bedroom (1.23x, 1.41x and 0.93x) and four or more bedroom (1.27x, 1.49x and 0.98x) properties.
[5] Similarly, Bristol is 71st in average rents for detached homes.


